
- Startseite >
- Flüsse >
- Wasserstand >
- Naab - Regen >
- Erbendorf >
- Jahresgrafik

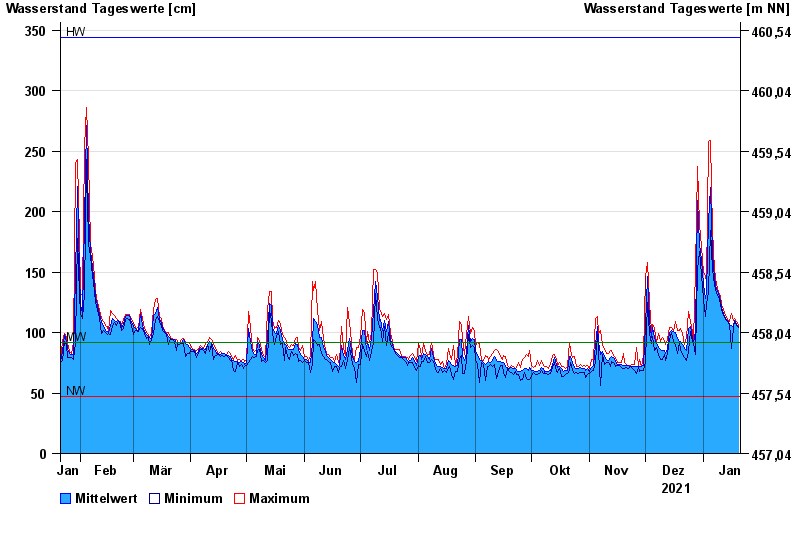
Jahresgrafik Erbendorf / Fichtelnaab
Wasserstand vom 21.01.2021 bis zum 20.01.2022
| Datum | Mittelwert [cm] | Maximum [cm] | Minimum [cm] |
|---|---|---|---|
| 20.01.2022 | 105 | 106 | 104 |
| 19.01.2022 | 107 | 109 | 106 |
| 18.01.2022 | 110 | 112 | 109 |
| 17.01.2022 | 105 | 110 | 104 |
| 16.01.2022 | 106 | 116 | 87 |
| 15.01.2022 | 107 | 109 | 107 |
| 14.01.2022 | 110 | 111 | 109 |
© Bayerisches Landesamt für Umwelt 2024