
- Startseite >
- Flüsse >
- Wasserstand >
- Naab - Regen >
- Erbendorf >
- Jahresgrafik

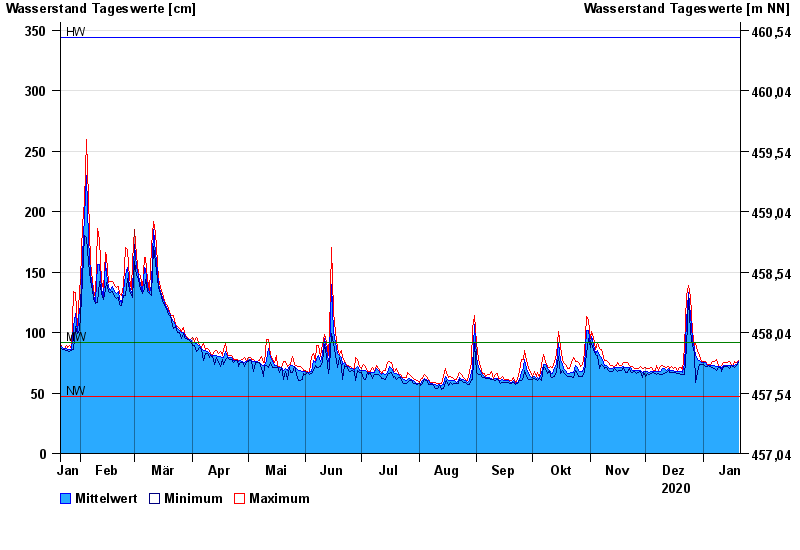
Jahresgrafik Erbendorf / Fichtelnaab
Wasserstand vom 21.01.2020 bis zum 20.01.2021
| Datum | Mittelwert [cm] | Maximum [cm] | Minimum [cm] |
|---|---|---|---|
| 20.01.2021 | 76 | 77 | 75 |
| 19.01.2021 | 74 | 75 | 73 |
| 18.01.2021 | 73 | 76 | 71 |
| 17.01.2021 | 73 | 73 | 72 |
| 16.01.2021 | 73 | 73 | 73 |
| 15.01.2021 | 73 | 76 | 70 |
| 14.01.2021 | 73 | 75 | 72 |
© Bayerisches Landesamt für Umwelt 2024