
- Startseite >
- Flüsse >
- Wasserstand >
- Naab - Regen >
- Erbendorf >
- Jahresgrafik

Jahresgrafik Erbendorf / Fichtelnaab
Wasserstand vom 30.03.2024 bis zum 29.03.2025
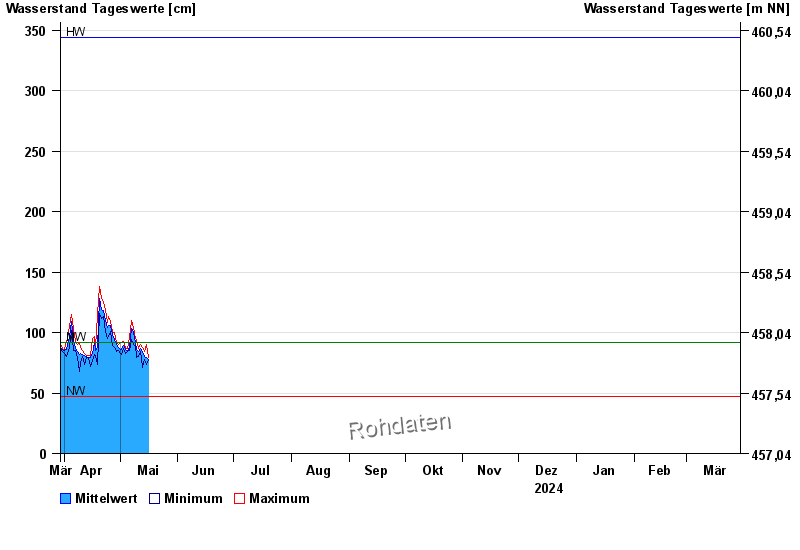
| Datum | Mittelwert [cm] | Maximum [cm] | Minimum [cm] |
|---|---|---|---|
| 29.04.2024 | 90 | 92 | 84 |
| 28.04.2024 | 94 | 100 | 88 |
| 27.04.2024 | 98 | 101 | 89 |
| 26.04.2024 | 106 | 109 | 101 |
| 25.04.2024 | 106 | 113 | 97 |
| 24.04.2024 | 104 | 108 | 95 |
| 23.04.2024 | 110 | 119 | 101 |
© Bayerisches Landesamt für Umwelt 2024