
- Startseite >
- Flüsse >
- Wasserstand >
- Naab - Regen >
- Erbendorf >
- Jahresgrafik

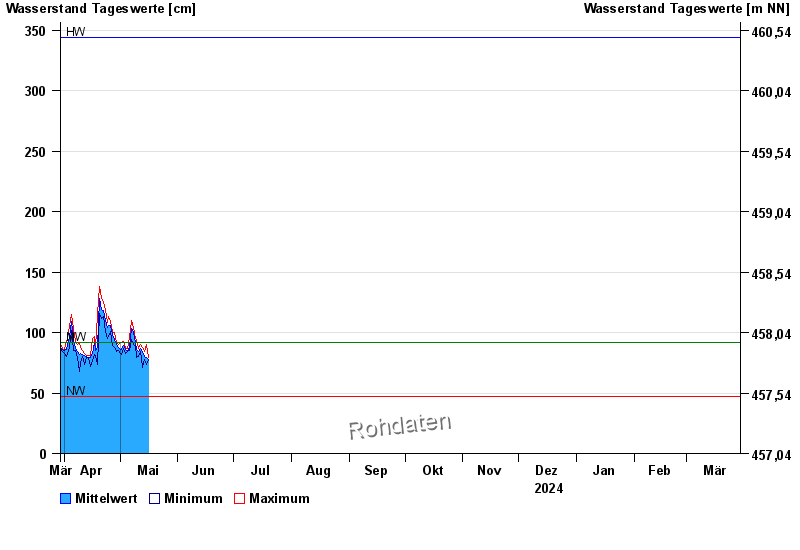
Jahresgrafik Erbendorf / Fichtelnaab
Wasserstand vom 30.03.2024 bis zum 29.03.2025
| Datum | Mittelwert [cm] | Maximum [cm] | Minimum [cm] |
|---|---|---|---|
| 05.06.2024 | 99 | 100 | 98 |
| 04.06.2024 | 104 | 109 | 96 |
| 03.06.2024 | 116 | 125 | 108 |
| 02.06.2024 | 126 | 129 | 123 |
| 01.06.2024 | 111 | 136 | 105 |
| 31.05.2024 | 118 | 127 | 108 |
| 30.05.2024 | 106 | 125 | 96 |
© Bayerisches Landesamt für Umwelt 2024