
- Startseite >
- Flüsse >
- Wasserstand >
- Unterer Main >
- Wertheim >
- Jahresgrafik

Jahresgrafik Wertheim / Main
Wasserstand vom 23.01.2021 bis zum 22.01.2022
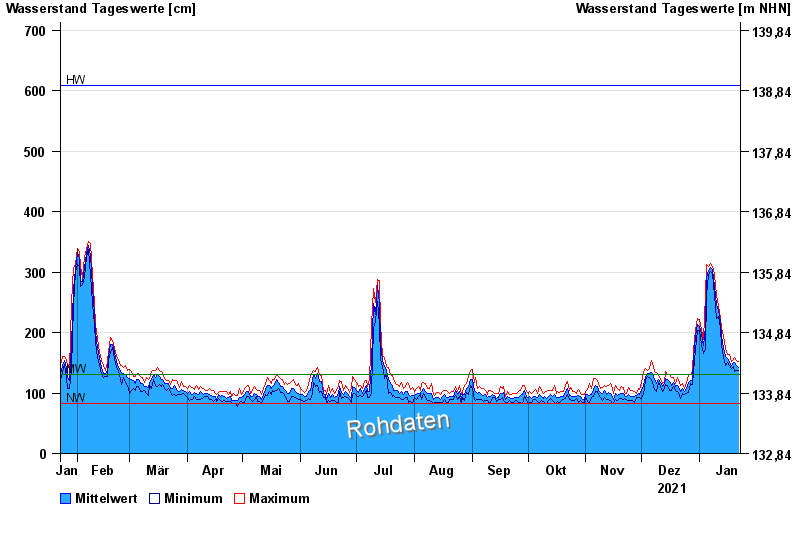
| Datum | Mittelwert [cm] | Maximum [cm] | Minimum [cm] |
|---|---|---|---|
| 22.01.2022 | 142 | 152 | 138 |
| 21.01.2022 | 146 | 153 | 137 |
| 20.01.2022 | 150 | 158 | 135 |
| 19.01.2022 | 150 | 156 | 144 |
| 18.01.2022 | 146 | 152 | 141 |
| 17.01.2022 | 151 | 164 | 145 |
| 16.01.2022 | 157 | 164 | 151 |
© Bayerisches Landesamt für Umwelt 2024