
- Startseite >
- Flüsse >
- Wasserstand >
- Unterer Main >
- Wertheim >
- Jahresgrafik

Jahresgrafik Wertheim / Main
Wasserstand vom 23.01.2020 bis zum 22.01.2021
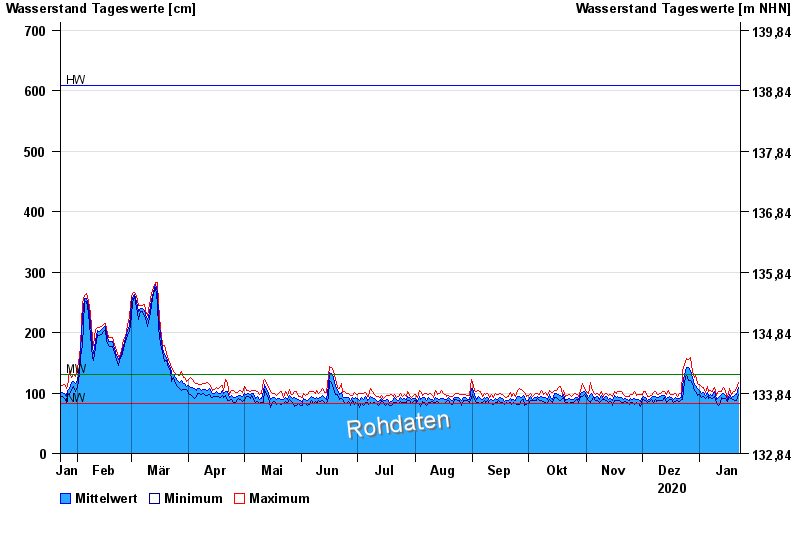
| Datum | Mittelwert [cm] | Maximum [cm] | Minimum [cm] |
|---|---|---|---|
| 22.01.2021 | 109 | 117 | 98 |
| 21.01.2021 | 97 | 107 | 87 |
| 20.01.2021 | 96 | 102 | 87 |
| 19.01.2021 | 95 | 102 | 89 |
| 18.01.2021 | 93 | 97 | 91 |
| 17.01.2021 | 97 | 108 | 92 |
| 16.01.2021 | 89 | 93 | 86 |
© Bayerisches Landesamt für Umwelt 2024