
- Startseite >
- Flüsse >
- Wasserstand >
- Unterer Main >
- Wertheim >
- Jahresgrafik

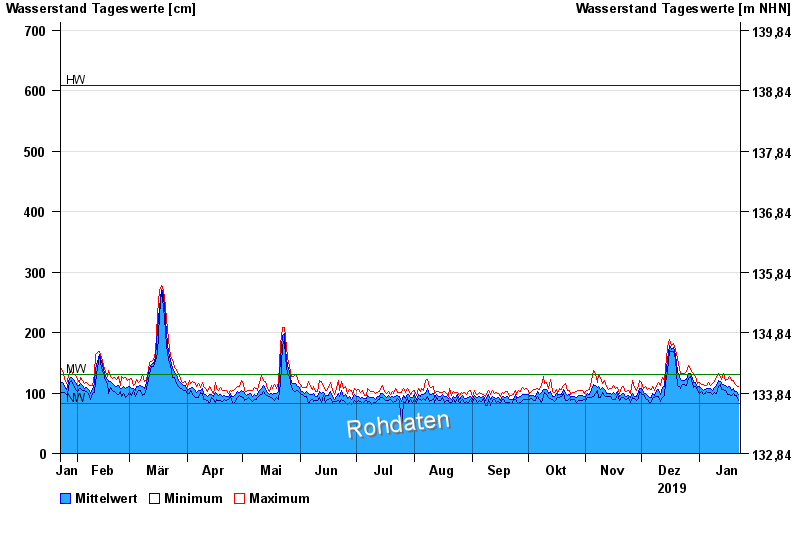
Jahresgrafik Wertheim / Main
Wasserstand vom 23.01.2019 bis zum 22.01.2020
| Datum | Mittelwert [cm] | Maximum [cm] | Minimum [cm] |
|---|---|---|---|
| 22.01.2020 | 98 | 110 | 88 |
| 21.01.2020 | 102 | 113 | 96 |
| 20.01.2020 | 102 | 115 | 96 |
| 19.01.2020 | 107 | 120 | 99 |
| 18.01.2020 | 104 | 120 | 96 |
| 17.01.2020 | 110 | 127 | 98 |
| 16.01.2020 | 109 | 123 | 98 |
© Bayerisches Landesamt für Umwelt 2024