
- Startseite >
- Flüsse >
- Wasserstand >
- Unterer Main >
- Faulbach >
- Jahresgrafik

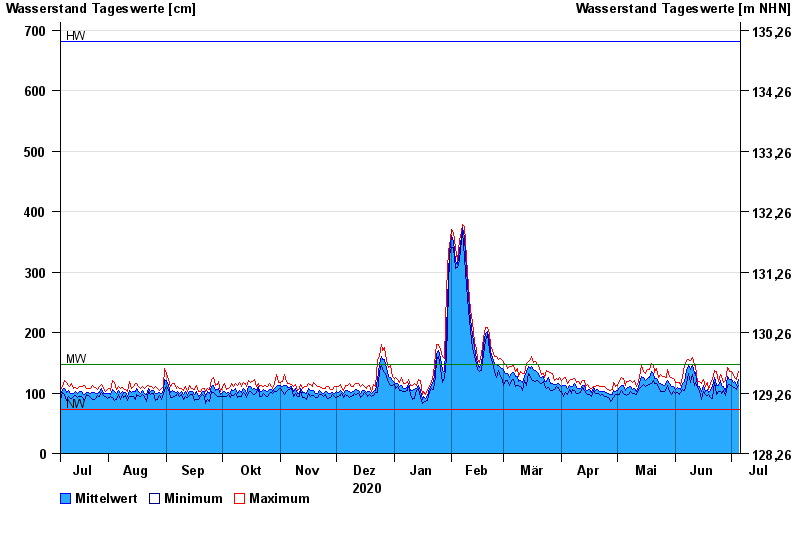
Jahresgrafik Faulbach / Main
Wasserstand vom 06.07.2020 bis zum 05.07.2021
| Datum | Mittelwert [cm] | Maximum [cm] | Minimum [cm] |
|---|---|---|---|
| 05.07.2021 | 122 | 135 | 113 |
| 04.07.2021 | 112 | 123 | 106 |
| 03.07.2021 | 119 | 126 | 109 |
| 02.07.2021 | 118 | 129 | 109 |
| 01.07.2021 | 122 | 136 | 113 |
| 30.06.2021 | 123 | 136 | 114 |
| 29.06.2021 | 127 | 142 | 113 |
© Bayerisches Landesamt für Umwelt 2024