
- Startseite >
- Flüsse >
- Wasserstand >
- Unterer Main >
- Faulbach >
- Jahresgrafik

Jahresgrafik Faulbach / Main
Wasserstand vom 06.07.2021 bis zum 05.07.2022
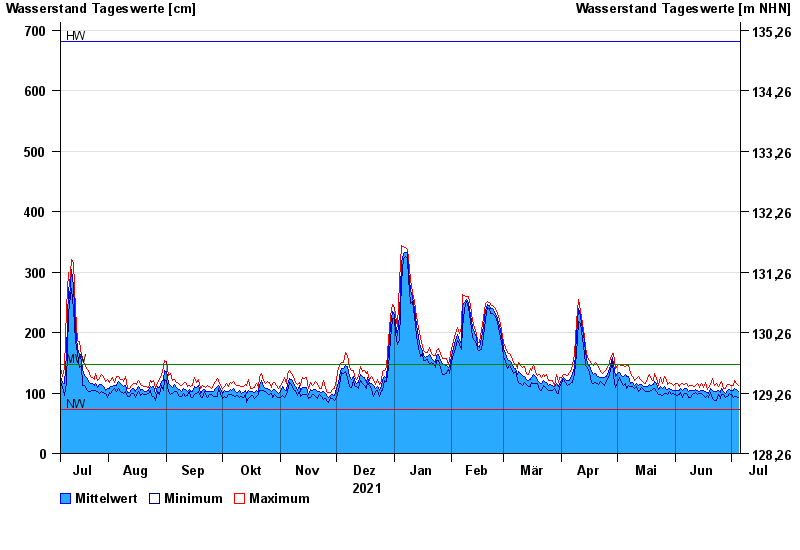
| Datum | Mittelwert [cm] | Maximum [cm] | Minimum [cm] |
|---|---|---|---|
| 05.07.2022 | 102 | 112 | 93 |
| 04.07.2022 | 106 | 115 | 94 |
| 03.07.2022 | 108 | 121 | 95 |
| 02.07.2022 | 105 | 113 | 93 |
| 01.07.2022 | 105 | 113 | 98 |
| 30.06.2022 | 106 | 114 | 100 |
| 29.06.2022 | 104 | 114 | 95 |
© Bayerisches Landesamt für Umwelt 2024