
- Startseite >
- Flüsse >
- Wasserstand >
- Unterer Main >
- Faulbach >
- Jahresgrafik

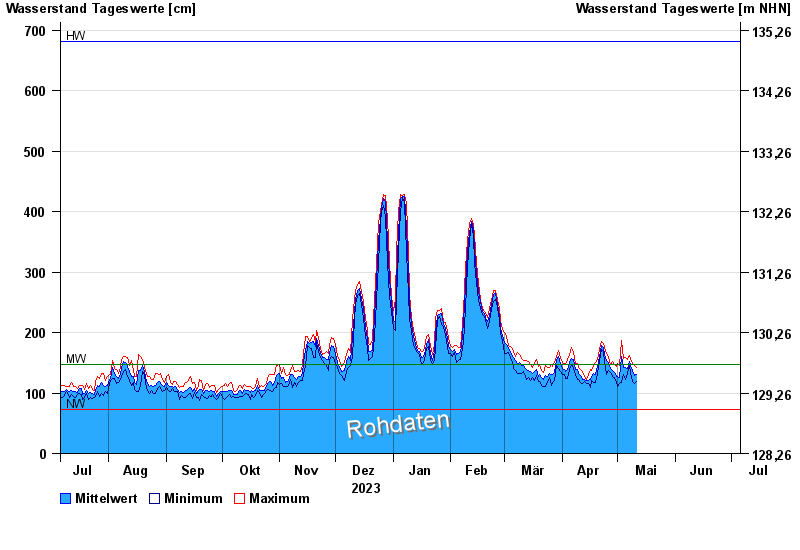
Jahresgrafik Faulbach / Main
Wasserstand vom 06.07.2023 bis zum 05.07.2024
| Datum | Mittelwert [cm] | Maximum [cm] | Minimum [cm] |
|---|---|---|---|
| 05.06.2024 | 282 | 285 | 278 |
| 04.06.2024 | 276 | 293 | 265 |
| 03.06.2024 | 279 | 302 | 246 |
| 02.06.2024 | 223 | 263 | 172 |
| 01.06.2024 | 150 | 176 | 133 |
| 31.05.2024 | 130 | 144 | 120 |
| 30.05.2024 | 130 | 139 | 125 |
© Bayerisches Landesamt für Umwelt 2024