
- Startseite >
- Flüsse >
- Wasserstand >
- Unterer Main >
- Faulbach >
- Jahresgrafik

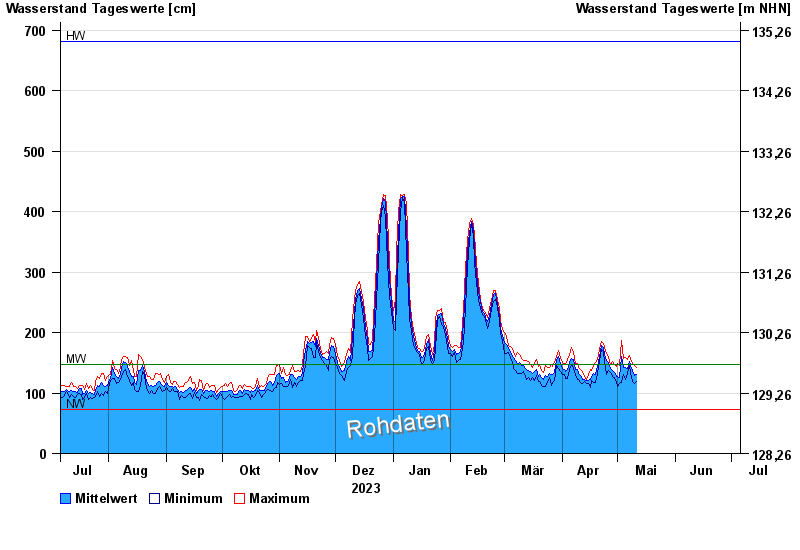
Jahresgrafik Faulbach / Main
Wasserstand vom 06.07.2023 bis zum 05.07.2024
| Datum | Mittelwert [cm] | Maximum [cm] | Minimum [cm] |
|---|---|---|---|
| 08.05.2024 | 148 | 157 | 136 |
| 07.05.2024 | 152 | 162 | 145 |
| 06.05.2024 | 141 | 155 | 133 |
| 05.05.2024 | 143 | 159 | 122 |
| 04.05.2024 | 142 | 157 | 130 |
| 03.05.2024 | 161 | 187 | 117 |
| 02.05.2024 | 125 | 145 | 115 |
© Bayerisches Landesamt für Umwelt 2024