
- Startseite >
- Flüsse >
- Wasserstand >
- Unterer Main >
- Faulbach >
- Jahresgrafik

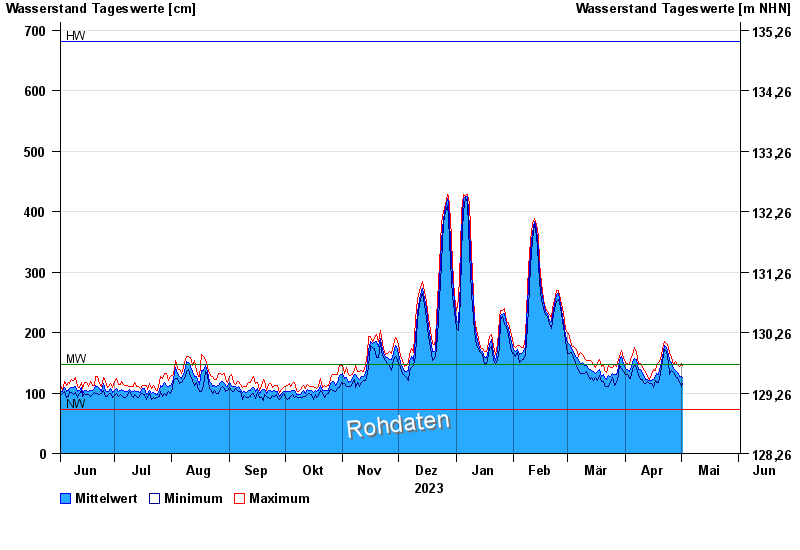
Jahresgrafik Faulbach / Main
Wasserstand vom 02.06.2023 bis zum 01.06.2024
| Datum | Mittelwert [cm] | Maximum [cm] | Minimum [cm] |
|---|---|---|---|
| 01.06.2024 | 150 | 176 | 133 |
| 31.05.2024 | 130 | 144 | 120 |
| 30.05.2024 | 130 | 139 | 125 |
| 29.05.2024 | 128 | 139 | 121 |
| 28.05.2024 | 130 | 138 | 118 |
| 27.05.2024 | 135 | 150 | 112 |
| 26.05.2024 | 149 | 165 | 130 |
© Bayerisches Landesamt für Umwelt 2024