
- Startseite >
- Flüsse >
- Wasserstand >
- Unterer Main >
- Faulbach >
- Jahresgrafik

Jahresgrafik Faulbach / Main
Wasserstand vom 02.06.2023 bis zum 01.06.2024
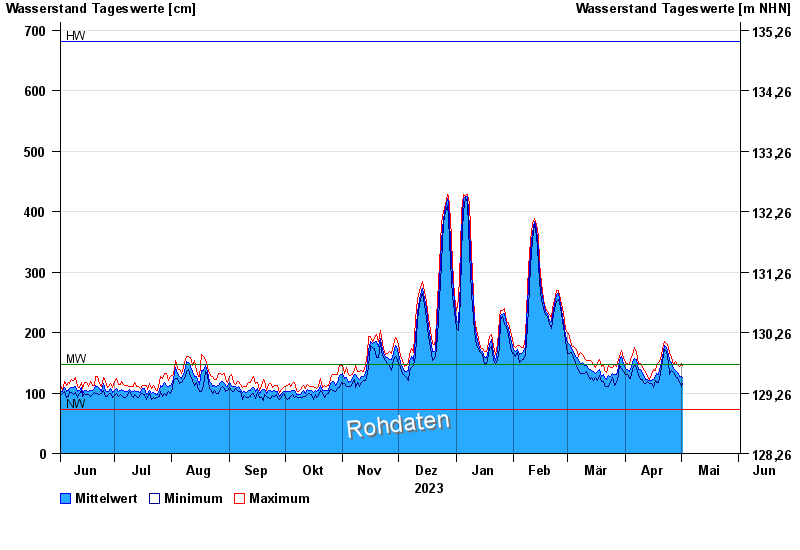
| Datum | Mittelwert [cm] | Maximum [cm] | Minimum [cm] |
|---|---|---|---|
| 19.04.2024 | 130 | 150 | 117 |
| 18.04.2024 | 133 | 145 | 118 |
| 17.04.2024 | 128 | 138 | 121 |
| 16.04.2024 | 123 | 139 | 109 |
| 15.04.2024 | 121 | 131 | 115 |
| 14.04.2024 | 120 | 123 | 116 |
| 13.04.2024 | 122 | 127 | 119 |
© Bayerisches Landesamt für Umwelt 2024