
- Startseite >
- Flüsse >
- Wasserstand >
- Unterer Main >
- Birkenfeld >
- Jahresgrafik

Jahresgrafik Birkenfeld / Aisch
Wasserstand vom 01.01.2024 bis zum 26.04.2024
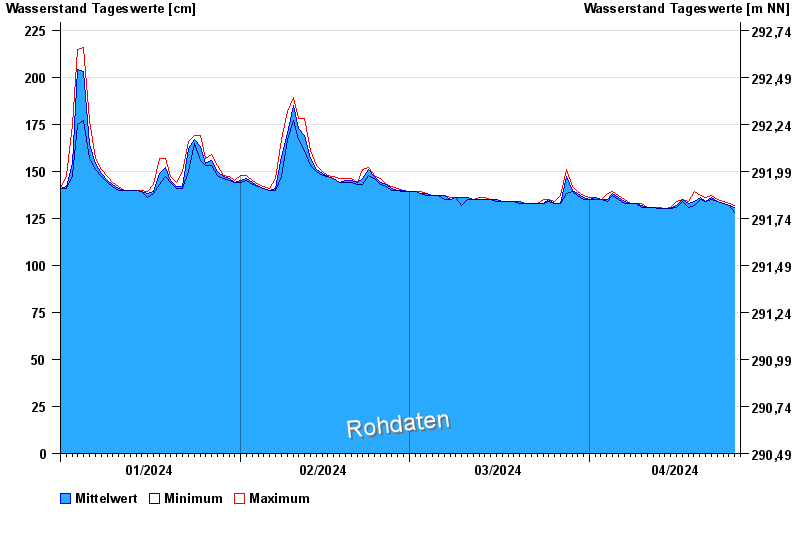
| Datum | Mittelwert [cm] | Maximum [cm] | Minimum [cm] |
|---|---|---|---|
| 26.04.2024 | 132 | 132 | 128 |
| 25.04.2024 | 132 | 133 | 132 |
| 24.04.2024 | 133 | 134 | 133 |
| 23.04.2024 | 134 | 135 | 134 |
| 22.04.2024 | 136 | 137 | 135 |
| 21.04.2024 | 134 | 136 | 134 |
| 20.04.2024 | 136 | 137 | 135 |
© Bayerisches Landesamt für Umwelt 2024