
- Startseite >
- Flüsse >
- Wasserstand >
- Unterer Main >
- Birkenfeld >
- Jahresgrafik

Jahresgrafik Birkenfeld / Aisch
Wasserstand vom 01.01.2024 bis zum 18.04.2024
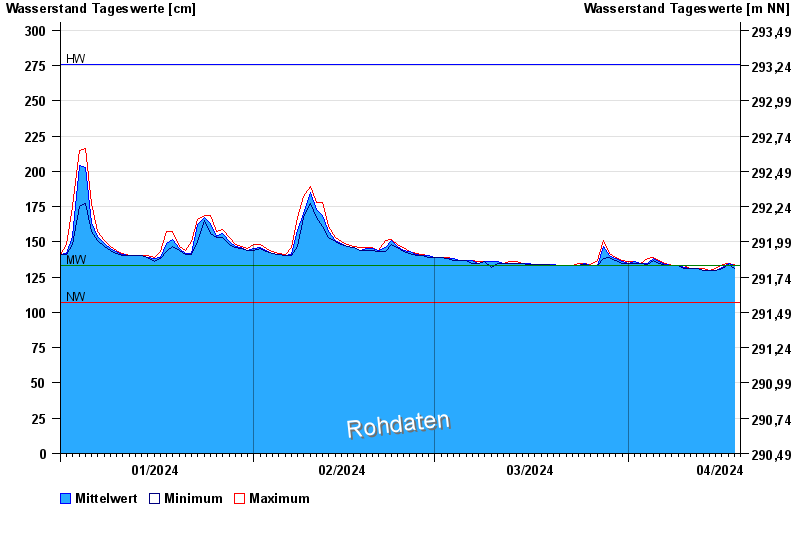
| Datum | Mittelwert [cm] | Maximum [cm] | Minimum [cm] |
|---|---|---|---|
| 18.04.2024 | 133 | 134 | 132 |
| 17.04.2024 | 135 | 135 | 134 |
| 16.04.2024 | 132 | 134 | 131 |
| 15.04.2024 | 130 | 131 | 130 |
| 14.04.2024 | 130 | 130 | 130 |
| 13.04.2024 | 130 | 131 | 130 |
| 12.04.2024 | 131 | 131 | 131 |
© Bayerisches Landesamt für Umwelt 2024