
- Startseite >
- Flüsse >
- Wasserstand >
- Unterer Main >
- Astheim >
- Jahresgrafik

Jahresgrafik Astheim / Main
Wasserstand vom 19.09.2019 bis zum 18.09.2020
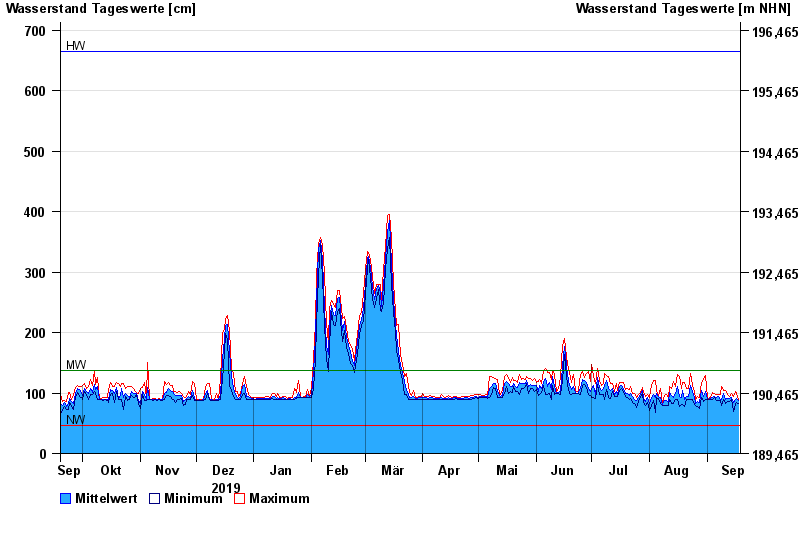
| Datum | Mittelwert [cm] | Maximum [cm] | Minimum [cm] |
|---|---|---|---|
| 18.09.2020 | 87 | 90 | 82 |
| 17.09.2020 | 91 | 99 | 85 |
| 16.09.2020 | 89 | 102 | 81 |
| 15.09.2020 | 85 | 94 | 70 |
| 14.09.2020 | 93 | 99 | 90 |
| 13.09.2020 | 91 | 95 | 86 |
| 12.09.2020 | 91 | 98 | 86 |
© Bayerisches Landesamt für Umwelt 2024