
- Startseite >
- Flüsse >
- Wasserstand >
- Unterer Main >
- Astheim >
- Jahresgrafik

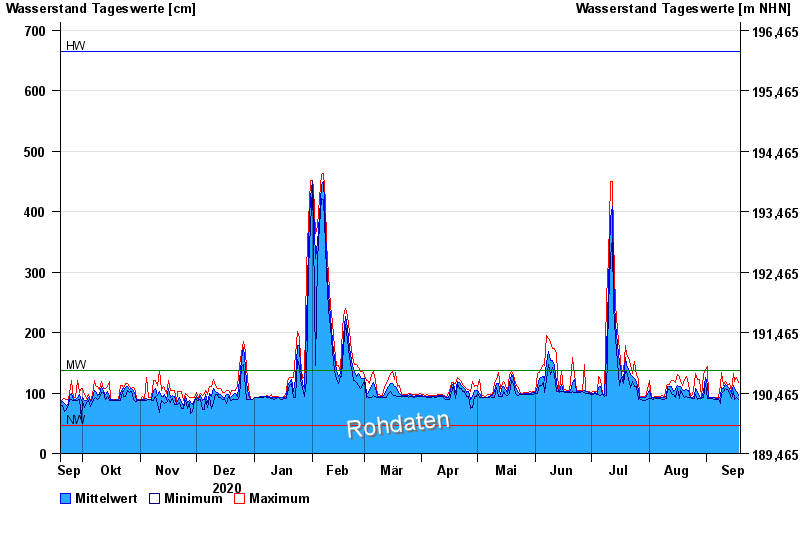
Jahresgrafik Astheim / Main
Wasserstand vom 19.09.2020 bis zum 18.09.2021
| Datum | Mittelwert [cm] | Maximum [cm] | Minimum [cm] |
|---|---|---|---|
| 18.09.2021 | 96 | 118 | 90 |
| 17.09.2021 | 102 | 125 | 92 |
| 16.09.2021 | 108 | 119 | 90 |
| 15.09.2021 | 112 | 133 | 102 |
| 14.09.2021 | 99 | 104 | 91 |
| 13.09.2021 | 108 | 115 | 101 |
| 12.09.2021 | 110 | 113 | 106 |
© Bayerisches Landesamt für Umwelt 2024