
- Startseite >
- Flüsse >
- Wasserstand >
- Obere Donau >
- Beilngries oberh. der Sulz >
- Jahresgrafik

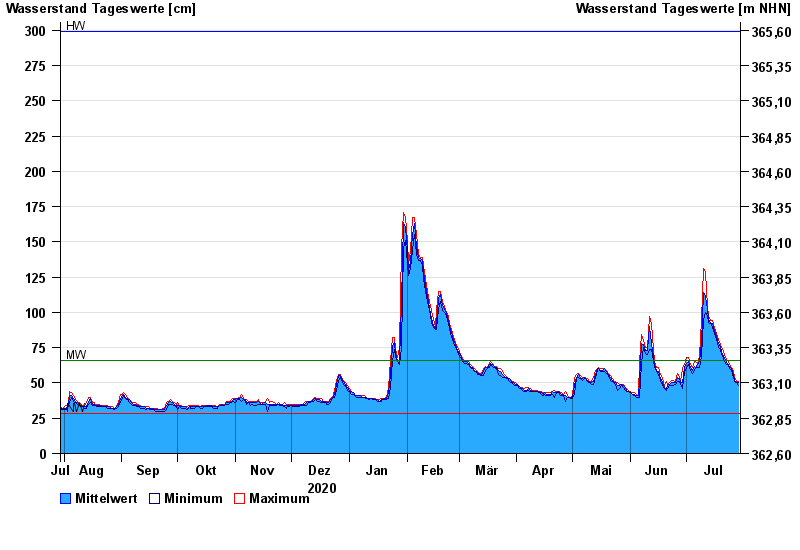
Jahresgrafik Beilngries oberh. der Sulz / Altmühl
Wasserstand vom 30.07.2020 bis zum 29.07.2021
| Datum | Mittelwert [cm] | Maximum [cm] | Minimum [cm] |
|---|---|---|---|
| 29.07.2021 | 50 | 51 | 48 |
| 28.07.2021 | 50 | 51 | 50 |
| 27.07.2021 | 52 | 54 | 51 |
| 26.07.2021 | 56 | 59 | 54 |
| 25.07.2021 | 60 | 61 | 59 |
| 24.07.2021 | 62 | 63 | 60 |
| 23.07.2021 | 64 | 66 | 63 |
© Bayerisches Landesamt für Umwelt 2024