
- Startseite >
- Flüsse >
- Wasserstand >
- Obere Donau >
- Beilngries oberh. der Sulz >
- Jahresgrafik

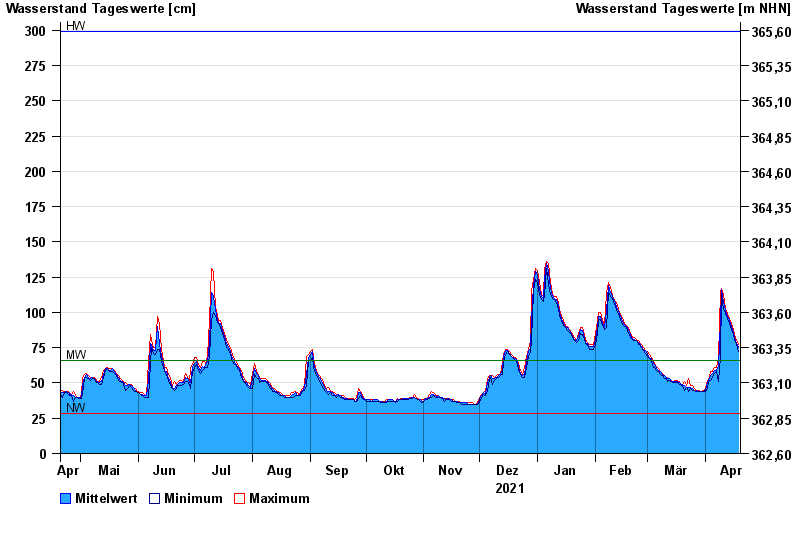
Jahresgrafik Beilngries oberh. der Sulz / Altmühl
Wasserstand vom 20.04.2021 bis zum 19.04.2022
| Datum | Mittelwert [cm] | Maximum [cm] | Minimum [cm] |
|---|---|---|---|
| 19.04.2022 | 75 | 77 | 72 |
| 18.04.2022 | 78 | 80 | 77 |
| 17.04.2022 | 82 | 84 | 80 |
| 16.04.2022 | 86 | 88 | 84 |
| 15.04.2022 | 90 | 92 | 88 |
| 14.04.2022 | 94 | 96 | 92 |
| 13.04.2022 | 97 | 99 | 96 |
© Bayerisches Landesamt für Umwelt 2024