
- Startseite >
- Flüsse >
- Wasserstand >
- Obere Donau >
- Beilngries oberh. der Sulz >
- Jahresgrafik

Jahresgrafik Beilngries oberh. der Sulz / Altmühl
Wasserstand vom 11.08.2021 bis zum 10.08.2022
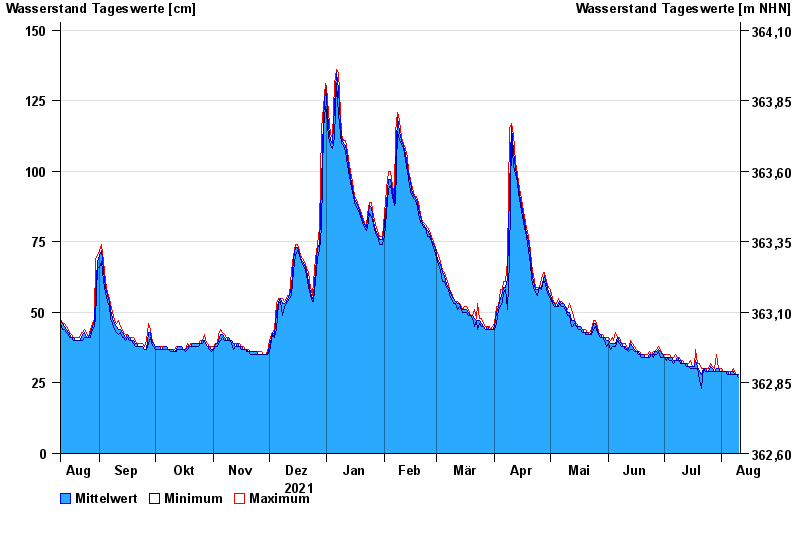
| Datum | Mittelwert [cm] | Maximum [cm] | Minimum [cm] |
|---|---|---|---|
| 10.08.2022 | 28 | 28 | 27 |
| 09.08.2022 | 28 | 28 | 28 |
| 08.08.2022 | 28 | 29 | 28 |
| 07.08.2022 | 29 | 30 | 28 |
| 06.08.2022 | 29 | 29 | 28 |
| 05.08.2022 | 28 | 29 | 28 |
| 04.08.2022 | 29 | 29 | 28 |
© Bayerisches Landesamt für Umwelt 2024