
- Startseite >
- Flüsse >
- Wasserstand >
- Isar >
- Hochberg >
- Jahresgrafik

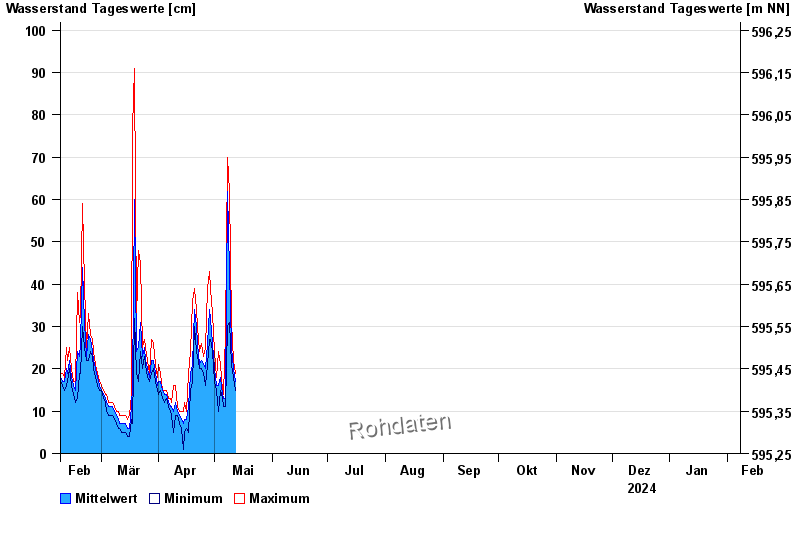
Jahresgrafik Hochberg / Traun
Wasserstand vom 08.02.2024 bis zum 07.02.2025
| Datum | Mittelwert [cm] | Maximum [cm] | Minimum [cm] |
|---|---|---|---|
| 24.05.2024 | 27 | 41 | 18 |
| 23.05.2024 | 19 | 69 | 8 |
| 22.05.2024 | 14 | 17 | 11 |
| 21.05.2024 | 8 | 11 | 6 |
| 20.05.2024 | 8 | 10 | 7 |
| 19.05.2024 | 9 | 10 | 7 |
| 18.05.2024 | 11 | 12 | 8 |
© Bayerisches Landesamt für Umwelt 2024