
- Startseite >
- Flüsse >
- Wasserstand >
- Isar >
- Hochberg >
- Jahresgrafik

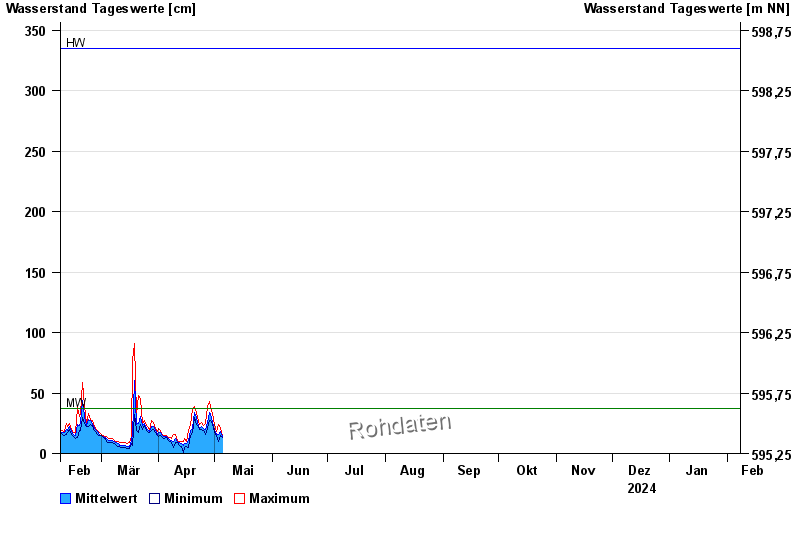
Jahresgrafik Hochberg / Traun
Wasserstand vom 08.02.2024 bis zum 07.02.2025
| Datum | Mittelwert [cm] | Maximum [cm] | Minimum [cm] |
|---|---|---|---|
| 18.06.2024 | 17 | 21 | 15 |
| 17.06.2024 | 18 | 20 | 16 |
| 16.06.2024 | 24 | 27 | 20 |
| 15.06.2024 | 20 | 23 | 19 |
| 14.06.2024 | 24 | 29 | 20 |
| 13.06.2024 | 28 | 43 | 22 |
| 12.06.2024 | 29 | 32 | 26 |
© Bayerisches Landesamt für Umwelt 2024