
- Startseite >
- Flüsse >
- Wasserstand >
- Iller - Lech - Bodensee >
- Rosenheim o.d. Mangfallmündung >
- Jahresgrafik

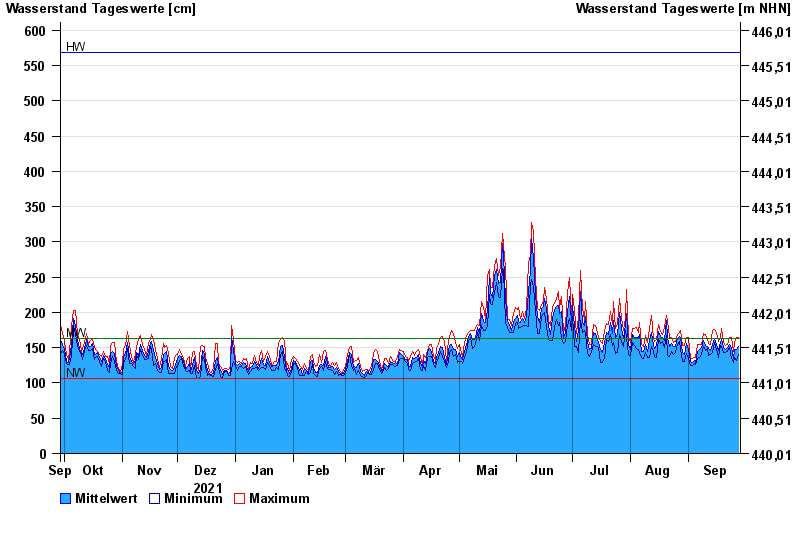
Jahresgrafik Rosenheim o.d. Mangfallmündung / Inn
Wasserstand vom 29.09.2021 bis zum 28.09.2022
| Datum | Mittelwert [cm] | Maximum [cm] | Minimum [cm] |
|---|---|---|---|
| 28.09.2022 | 152 | 165 | 141 |
| 27.09.2022 | 147 | 165 | 132 |
| 26.09.2022 | 147 | 157 | 136 |
| 25.09.2022 | 135 | 144 | 129 |
| 24.09.2022 | 150 | 165 | 135 |
| 23.09.2022 | 155 | 164 | 150 |
| 22.09.2022 | 150 | 155 | 145 |
© Bayerisches Landesamt für Umwelt 2024