
- Startseite >
- Flüsse >
- Schwebstoff >
- Iller - Lech - Bodensee >
- Rosenheim o.d. Mangfallmündung >
- Jahresgrafik

Jahresgrafik Rosenheim o.d. Mangfallmündung / Inn
Schwebstoff vom 01.01.2024 bis zum 18.04.2024
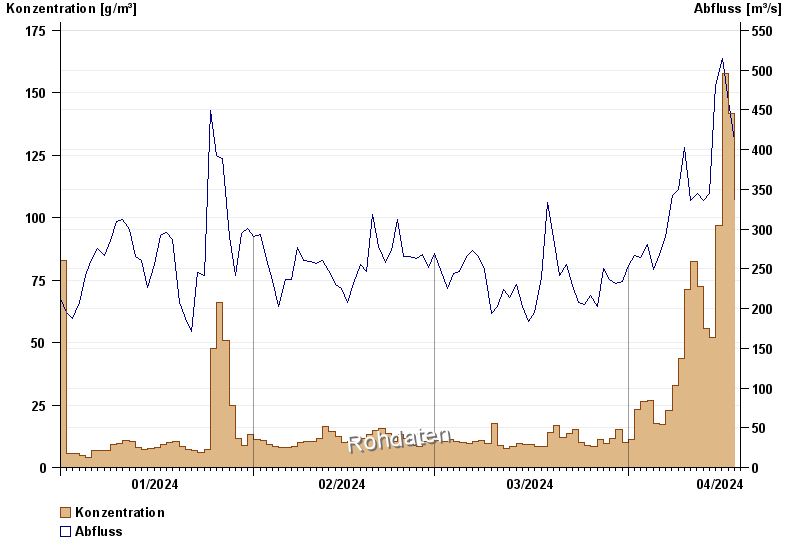
| Datum | Konzentration [g/m³] | Abfluss [m³/s] |
|---|---|---|
| 18.04.2024 | 107,3 | 411 |
| 17.04.2024 | 141,6 | 460 |
| 16.04.2024 | 157,6 | 515 |
| 15.04.2024 | 96,8 | 480 |
| 14.04.2024 | 52,0 | 345 |
| 13.04.2024 | 55,6 | 336 |
| 12.04.2024 | 72,4 | 345 |
© Bayerisches Landesamt für Umwelt 2024