
- Startseite >
- Flüsse >
- Wasserstand >
- Iller - Lech - Bodensee >
- Rosenheim o.d. Mangfallmündung >
- Jahresgrafik

Jahresgrafik Rosenheim o.d. Mangfallmündung / Inn
Wasserstand vom 29.09.2022 bis zum 28.09.2023
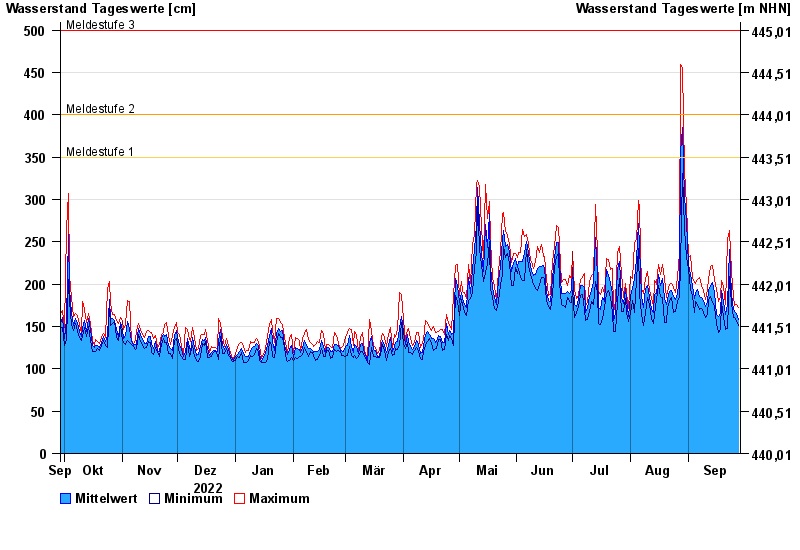
- Meldestufe 1 350 cm
- Meldestufe 2 400 cm
- Meldestufe 3 500 cm
- Hochwassergefahrenfläche HQ100 570 cm
| Datum | Mittelwert [cm] | Maximum [cm] | Minimum [cm] |
|---|---|---|---|
| 28.09.2023 | 158 | 173 | 151 |
| 27.09.2023 | 165 | 176 | 156 |
| 26.09.2023 | 168 | 175 | 161 |
| 25.09.2023 | 170 | 185 | 161 |
| 24.09.2023 | 188 | 215 | 177 |
| 23.09.2023 | 241 | 263 | 209 |
| 22.09.2023 | 176 | 253 | 148 |
© Bayerisches Landesamt für Umwelt 2024