
- Startseite >
- Flüsse >
- Wasserstand >
- Iller - Lech - Bodensee >
- Oberaudorf >
- Jahresgrafik

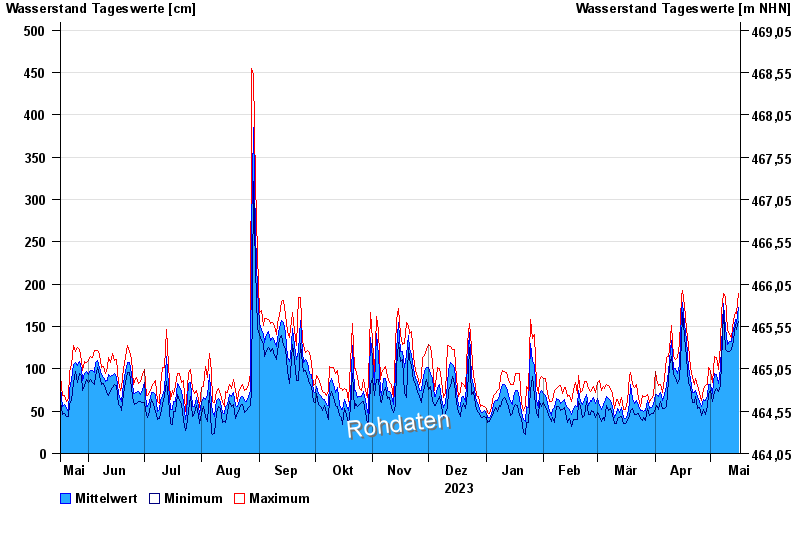
Jahresgrafik Oberaudorf / Inn
Wasserstand vom 17.05.2023 bis zum 16.05.2024
| Datum | Mittelwert [cm] | Maximum [cm] | Minimum [cm] |
|---|---|---|---|
| 01.05.2024 | 83 | 97 | 74 |
| 30.04.2024 | 82 | 101 | 70 |
| 29.04.2024 | 67 | 81 | 56 |
| 28.04.2024 | 63 | 80 | 46 |
| 27.04.2024 | 64 | 76 | 52 |
| 26.04.2024 | 55 | 63 | 45 |
| 25.04.2024 | 61 | 71 | 54 |
© Bayerisches Landesamt für Umwelt 2024