
- Startseite >
- Flüsse >
- Wasserstand >
- Iller - Lech - Bodensee >
- Oberaudorf >
- Jahresgrafik

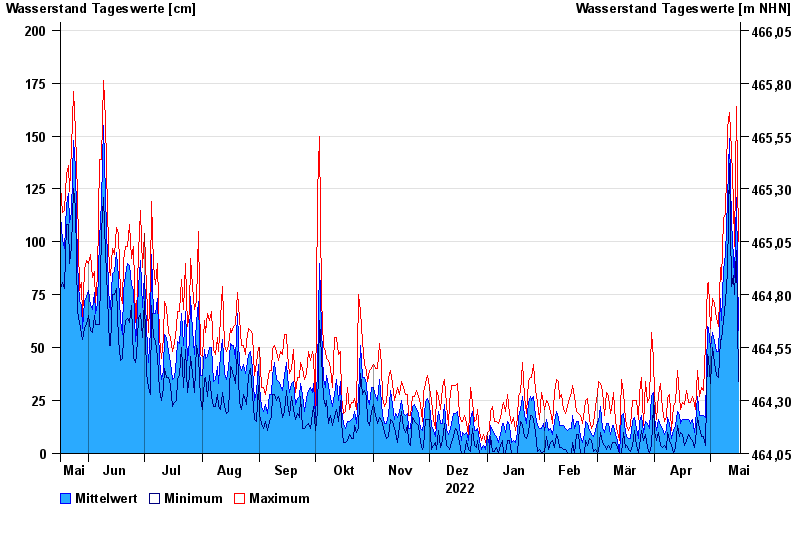
Jahresgrafik Oberaudorf / Inn
Wasserstand vom 17.05.2022 bis zum 16.05.2023
| Datum | Mittelwert [cm] | Maximum [cm] | Minimum [cm] |
|---|---|---|---|
| 16.05.2023 | 58 | 100 | 34 |
| 15.05.2023 | 121 | 164 | 96 |
| 14.05.2023 | 83 | 98 | 75 |
| 13.05.2023 | 92 | 119 | 84 |
| 12.05.2023 | 109 | 143 | 79 |
| 11.05.2023 | 149 | 161 | 137 |
| 10.05.2023 | 120 | 154 | 86 |
© Bayerisches Landesamt für Umwelt 2024