
- Startseite >
- Flüsse >
- Wasserstand >
- Iller - Lech - Bodensee >
- Oberaudorf >
- Jahresgrafik

Jahresgrafik Oberaudorf / Inn
Wasserstand vom 17.05.2021 bis zum 16.05.2022
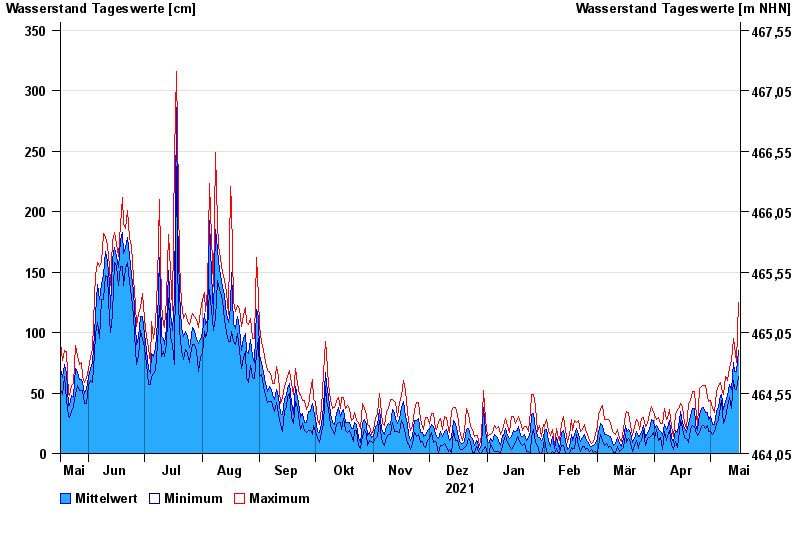
| Datum | Mittelwert [cm] | Maximum [cm] | Minimum [cm] |
|---|---|---|---|
| 16.05.2022 | 85 | 125 | 64 |
| 15.05.2022 | 68 | 75 | 53 |
| 14.05.2022 | 68 | 89 | 54 |
| 13.05.2022 | 75 | 95 | 60 |
| 12.05.2022 | 53 | 77 | 37 |
| 11.05.2022 | 57 | 70 | 46 |
| 10.05.2022 | 48 | 60 | 39 |
© Bayerisches Landesamt für Umwelt 2024