
- Startseite >
- Flüsse >
- Wasserstand >
- Iller - Lech - Bodensee >
- Lechbruck >
- Jahresgrafik

Jahresgrafik Lechbruck / Lech
Wasserstand vom 01.01.2024 bis zum 10.05.2024
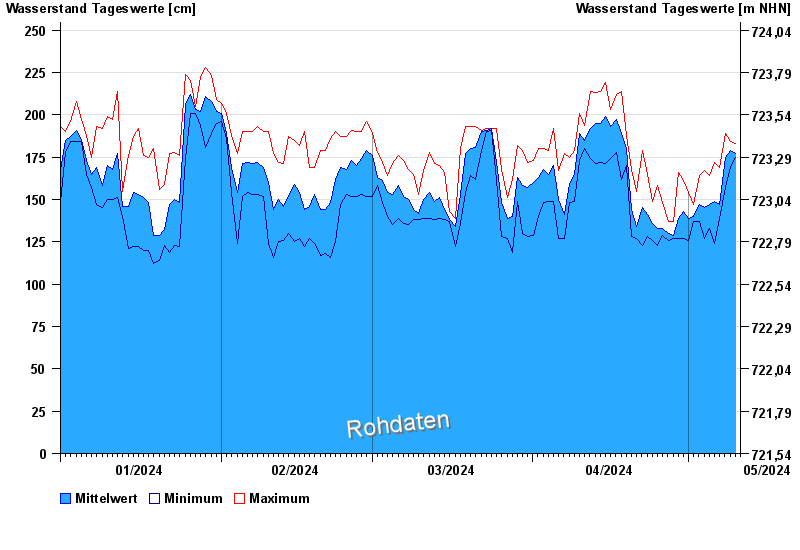
Hinweis
Messwerte beeinflusst durch Kraftwerkssteuerungen.
- 22.05.1999 Wasserstand: 457 cm
- 23.08.2005 Wasserstand: 455 cm
- 10.08.1970 Wasserstand: 448 cm
- 13.05.1999 Wasserstand: 419 cm
- 06.07.1997 Wasserstand: 377 cm
| Datum | Mittelwert [cm] | Maximum [cm] | Minimum [cm] |
|---|---|---|---|
| 10.05.2024 | 178 | 183 | 175 |
| 09.05.2024 | 179 | 184 | 169 |
| 08.05.2024 | 175 | 189 | 157 |
| 07.05.2024 | 147 | 169 | 139 |
| 06.05.2024 | 149 | 172 | 124 |
| 05.05.2024 | 147 | 164 | 133 |
| 04.05.2024 | 145 | 167 | 127 |
© Bayerisches Landesamt für Umwelt 2024