
- Startseite >
- Flüsse >
- Wasserstand >
- Iller - Lech - Bodensee >
- Lechbruck >
- Jahresgrafik

Jahresgrafik Lechbruck / Lech
Wasserstand vom 01.01.2024 bis zum 20.04.2024
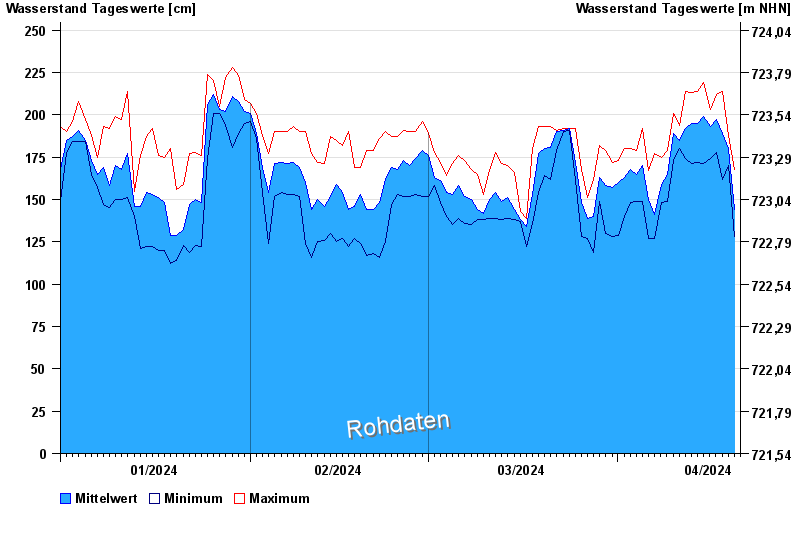
Hinweis
Messwerte beeinflusst durch Kraftwerkssteuerungen.
| Datum | Mittelwert [cm] | Maximum [cm] | Minimum [cm] |
|---|---|---|---|
| 20.04.2024 | 154 | 168 | 148 |
| 19.04.2024 | 180 | 188 | 170 |
| 18.04.2024 | 189 | 214 | 162 |
| 17.04.2024 | 197 | 212 | 178 |
| 16.04.2024 | 193 | 203 | 174 |
| 15.04.2024 | 199 | 219 | 171 |
| 14.04.2024 | 195 | 214 | 172 |
© Bayerisches Landesamt für Umwelt 2024