
- Startseite >
- Flüsse >
- Wasserstand >
- Iller - Lech - Bodensee >
- Görisried >
- Jahresgrafik

Jahresgrafik Görisried / Waldbach
Wasserstand vom 28.02.2020 bis zum 27.02.2021
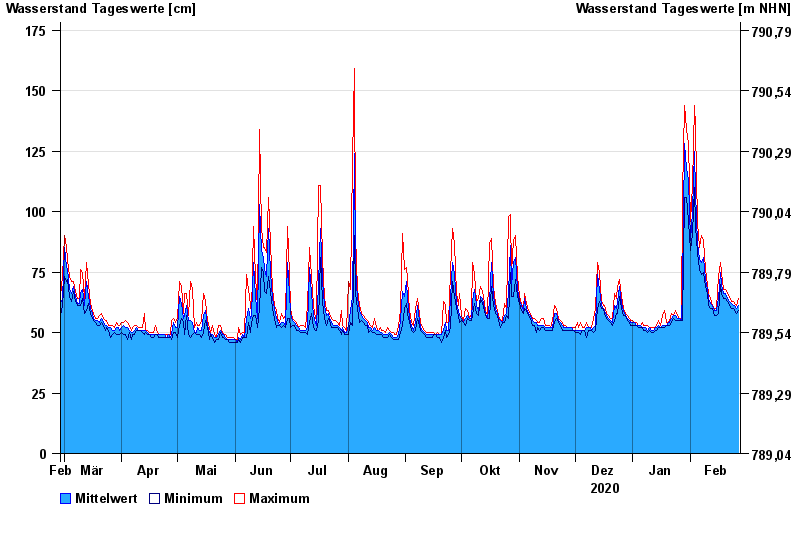
| Datum | Mittelwert [cm] | Maximum [cm] | Minimum [cm] |
|---|---|---|---|
| 27.02.2021 | 61 | 64 | 59 |
| 26.02.2021 | 60 | 61 | 58 |
| 25.02.2021 | 61 | 62 | 59 |
| 24.02.2021 | 61 | 63 | 60 |
| 23.02.2021 | 62 | 63 | 60 |
| 22.02.2021 | 63 | 65 | 61 |
| 21.02.2021 | 64 | 66 | 63 |
© Bayerisches Landesamt für Umwelt 2024