
- Startseite >
- Flüsse >
- Wasserstand >
- Iller - Lech - Bodensee >
- Görisried >
- Jahresgrafik

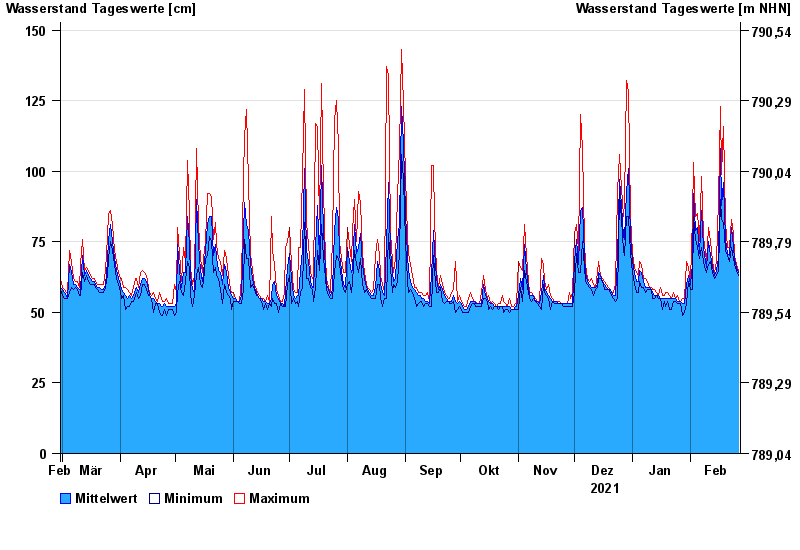
Jahresgrafik Görisried / Waldbach
Wasserstand vom 28.02.2021 bis zum 27.02.2022
| Datum | Mittelwert [cm] | Maximum [cm] | Minimum [cm] |
|---|---|---|---|
| 27.02.2022 | 64 | 65 | 63 |
| 26.02.2022 | 66 | 67 | 65 |
| 25.02.2022 | 69 | 70 | 67 |
| 24.02.2022 | 73 | 78 | 69 |
| 23.02.2022 | 80 | 83 | 73 |
| 22.02.2022 | 70 | 73 | 68 |
| 21.02.2022 | 71 | 73 | 70 |
© Bayerisches Landesamt für Umwelt 2024