
- Startseite >
- Flüsse >
- Wasserstand >
- Bayern >
- Pfelling >
- Jahresgrafik

Jahresgrafik Pfelling / Donau
Wasserstand vom 26.01.2022 bis zum 25.01.2023
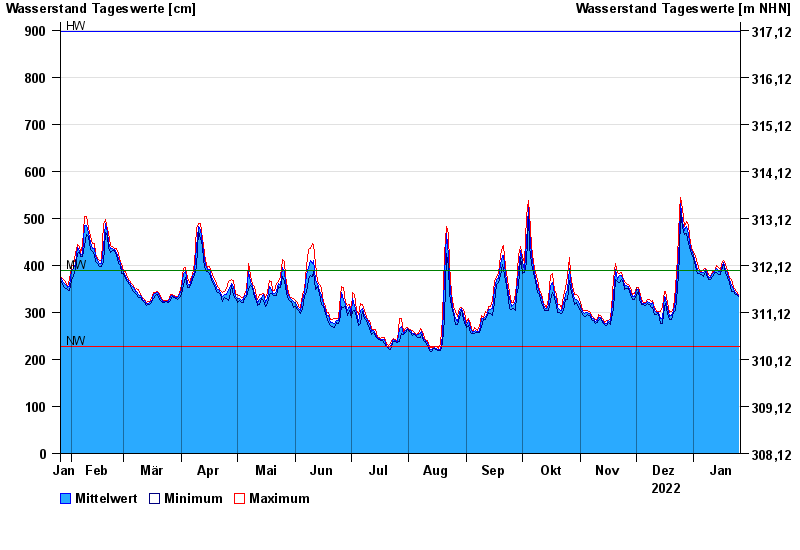
| Datum | Mittelwert [cm] | Maximum [cm] | Minimum [cm] |
|---|---|---|---|
| 25.01.2023 | 336 | 339 | 333 |
| 24.01.2023 | 341 | 344 | 337 |
| 23.01.2023 | 345 | 350 | 341 |
| 22.01.2023 | 350 | 354 | 344 |
| 21.01.2023 | 358 | 369 | 344 |
| 20.01.2023 | 370 | 375 | 364 |
| 19.01.2023 | 383 | 389 | 375 |
© Bayerisches Landesamt für Umwelt 2024