
- Startseite >
- Flüsse >
- Wasserstand >
- Bayern >
- Pfelling >
- Jahresgrafik

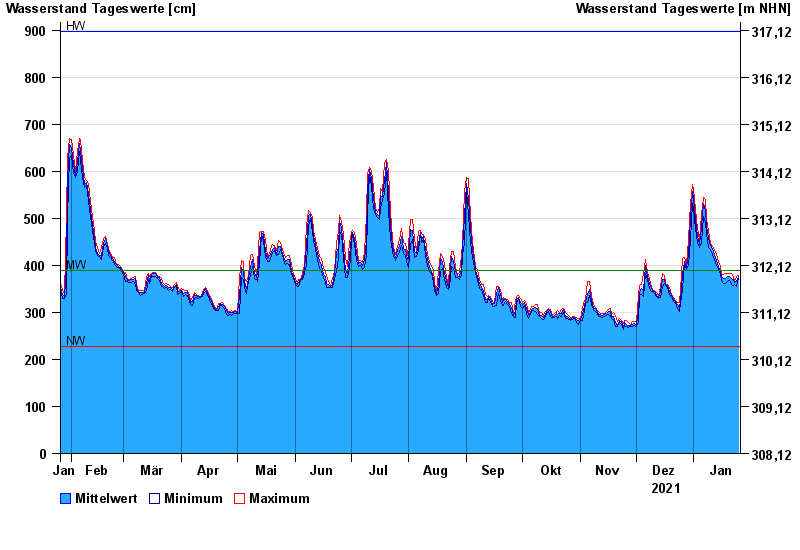
Jahresgrafik Pfelling / Donau
Wasserstand vom 26.01.2021 bis zum 25.01.2022
| Datum | Mittelwert [cm] | Maximum [cm] | Minimum [cm] |
|---|---|---|---|
| 25.01.2022 | 377 | 379 | 372 |
| 24.01.2022 | 366 | 377 | 356 |
| 23.01.2022 | 364 | 366 | 359 |
| 22.01.2022 | 371 | 377 | 358 |
| 21.01.2022 | 373 | 383 | 359 |
| 20.01.2022 | 376 | 382 | 367 |
| 19.01.2022 | 377 | 383 | 366 |
© Bayerisches Landesamt für Umwelt 2024