
- Startseite >
- Flüsse >
- Wasserstand >
- Bayern >
- Oberndorf >
- Jahresgrafik

Jahresgrafik Oberndorf / Donau
Wasserstand vom 20.01.2023 bis zum 19.01.2024
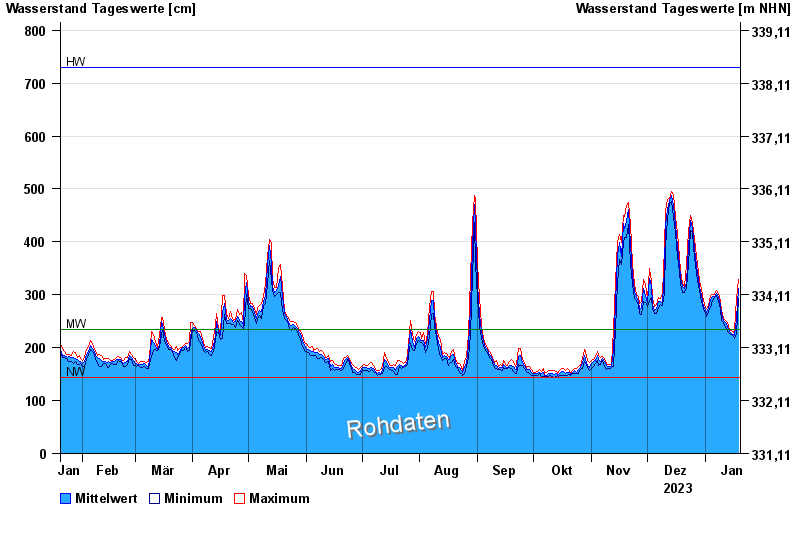
| Datum | Mittelwert [cm] | Maximum [cm] | Minimum [cm] |
|---|---|---|---|
| 19.01.2024 | 311 | 328 | 293 |
| 18.01.2024 | 255 | 292 | 225 |
| 17.01.2024 | 223 | 234 | 218 |
| 16.01.2024 | 224 | 229 | 221 |
| 15.01.2024 | 226 | 232 | 224 |
| 14.01.2024 | 230 | 235 | 226 |
| 13.01.2024 | 240 | 247 | 230 |
© Bayerisches Landesamt für Umwelt 2024