
- Startseite >
- Flüsse >
- Wasserstand >
- Bayern >
- Oberndorf >
- Jahresgrafik

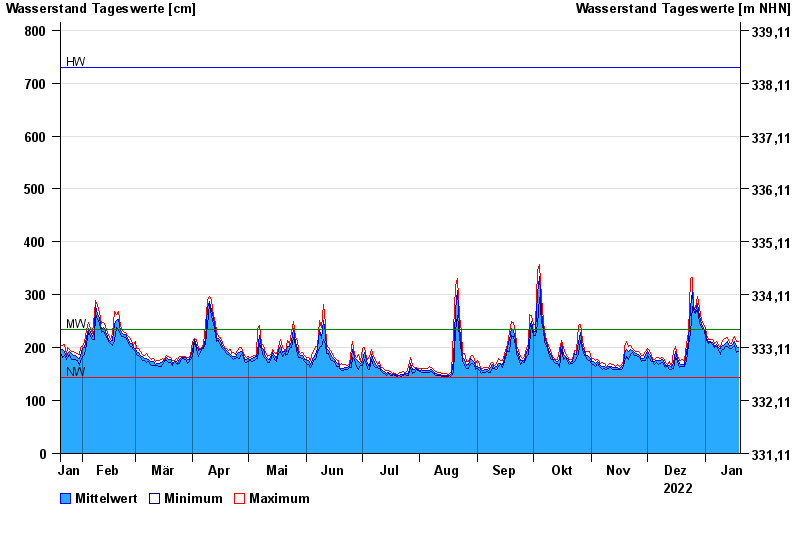
Jahresgrafik Oberndorf / Donau
Wasserstand vom 20.01.2022 bis zum 19.01.2023
| Datum | Mittelwert [cm] | Maximum [cm] | Minimum [cm] |
|---|---|---|---|
| 19.01.2023 | 201 | 211 | 193 |
| 18.01.2023 | 203 | 211 | 190 |
| 17.01.2023 | 212 | 221 | 204 |
| 16.01.2023 | 208 | 220 | 203 |
| 15.01.2023 | 204 | 208 | 198 |
| 14.01.2023 | 203 | 209 | 199 |
| 13.01.2023 | 212 | 220 | 203 |
© Bayerisches Landesamt für Umwelt 2024