
- Startseite >
- Flüsse >
- Wasserstand >
- Bayern >
- Obernach >
- Jahresgrafik

Jahresgrafik Obernach / Ach
Wasserstand vom 30.03.2024 bis zum 29.03.2025
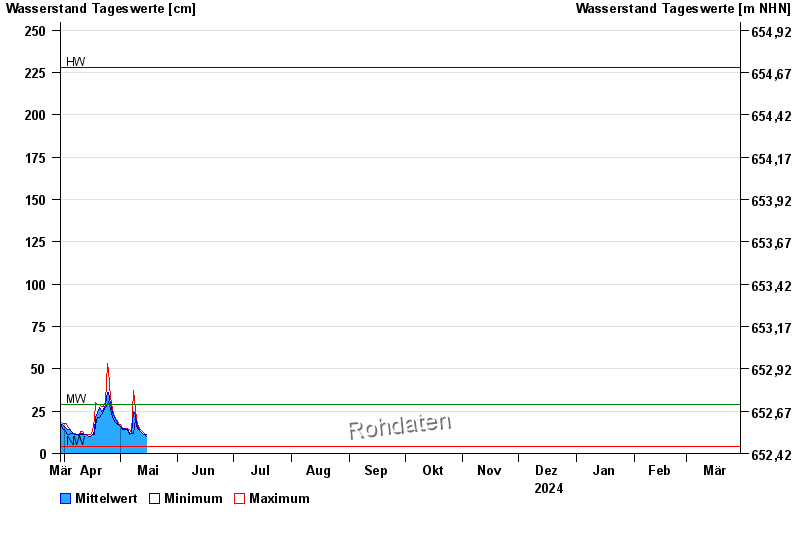
| Datum | Mittelwert [cm] | Maximum [cm] | Minimum [cm] |
|---|---|---|---|
| 28.04.2024 | 21 | 22 | 20 |
| 27.04.2024 | 24 | 26 | 22 |
| 26.04.2024 | 29 | 33 | 26 |
| 25.04.2024 | 36 | 49 | 31 |
| 24.04.2024 | 36 | 53 | 29 |
| 23.04.2024 | 29 | 31 | 27 |
| 22.04.2024 | 26 | 28 | 25 |
© Bayerisches Landesamt für Umwelt 2024