
- Startseite >
- Flüsse >
- Wasserstand >
- Bayern >
- Obernach >
- Jahresgrafik

Jahresgrafik Obernach / Ach
Wasserstand vom 30.03.2024 bis zum 29.03.2025
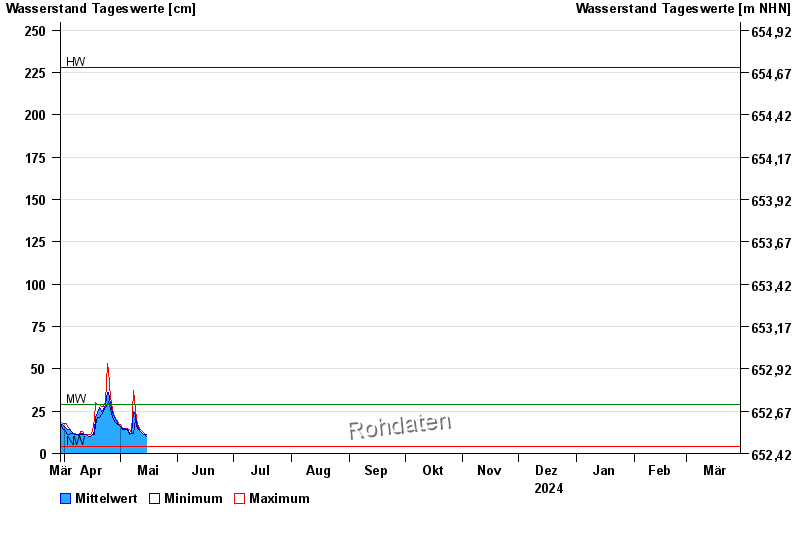
| Datum | Mittelwert [cm] | Maximum [cm] | Minimum [cm] |
|---|---|---|---|
| 14.05.2024 | 12 | 12 | 11 |
| 13.05.2024 | 12 | 13 | 12 |
| 12.05.2024 | 13 | 14 | 13 |
| 11.05.2024 | 15 | 16 | 14 |
| 10.05.2024 | 18 | 20 | 16 |
| 09.05.2024 | 23 | 26 | 20 |
| 08.05.2024 | 25 | 37 | 12 |
© Bayerisches Landesamt für Umwelt 2024