
- Startseite >
- Flüsse >
- Wasserstand >
- Bayern >
- Laubendorf >
- Jahresgrafik

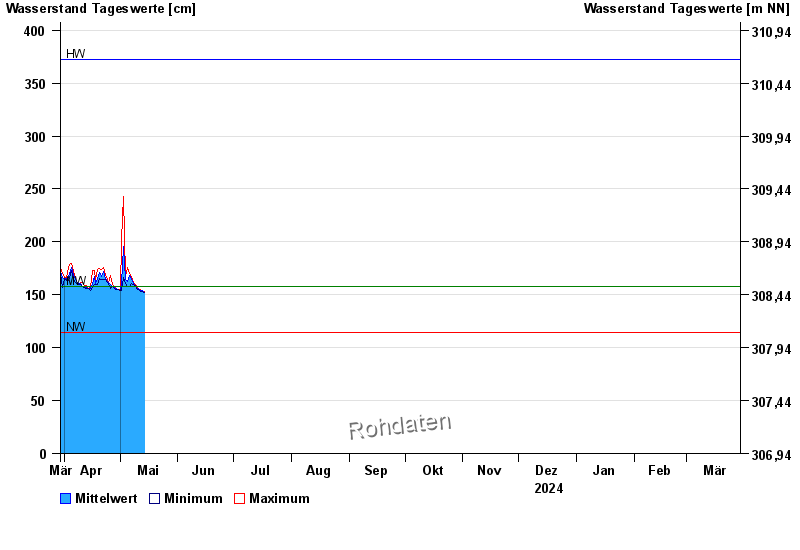
Jahresgrafik Laubendorf / Zenn
Wasserstand vom 30.03.2024 bis zum 29.03.2025
| Datum | Mittelwert [cm] | Maximum [cm] | Minimum [cm] |
|---|---|---|---|
| 08.06.2024 | 170 | 170 | 170 |
| 07.06.2024 | 174 | 176 | 171 |
| 06.06.2024 | 179 | 180 | 176 |
| 05.06.2024 | 189 | 192 | 179 |
| 04.06.2024 | 206 | 223 | 192 |
| 03.06.2024 | 263 | 300 | 223 |
| 02.06.2024 | 296 | 300 | 287 |
© Bayerisches Landesamt für Umwelt 2024