
- Startseite >
- Flüsse >
- Wasserstand >
- Bayern >
- Laubendorf >
- Jahresgrafik

Jahresgrafik Laubendorf / Zenn
Wasserstand vom 30.03.2024 bis zum 29.03.2025
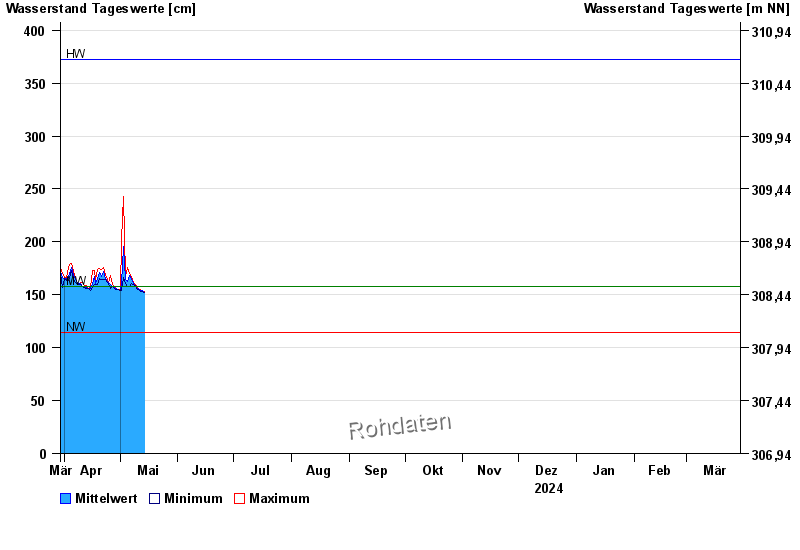
| Datum | Mittelwert [cm] | Maximum [cm] | Minimum [cm] |
|---|---|---|---|
| 28.04.2024 | 157 | 158 | 156 |
| 27.04.2024 | 158 | 160 | 158 |
| 26.04.2024 | 160 | 168 | 156 |
| 25.04.2024 | 162 | 162 | 160 |
| 24.04.2024 | 162 | 164 | 162 |
| 23.04.2024 | 165 | 168 | 164 |
| 22.04.2024 | 172 | 176 | 164 |
© Bayerisches Landesamt für Umwelt 2024