
- Startseite >
- Flüsse >
- Schwebstoff >
- Inn >
- Neu Ulm, Bad Held >
- Jahresgrafik

Jahresgrafik Neu Ulm, Bad Held / Donau
Schwebstoff vom 01.01.2024 bis zum 03.05.2024
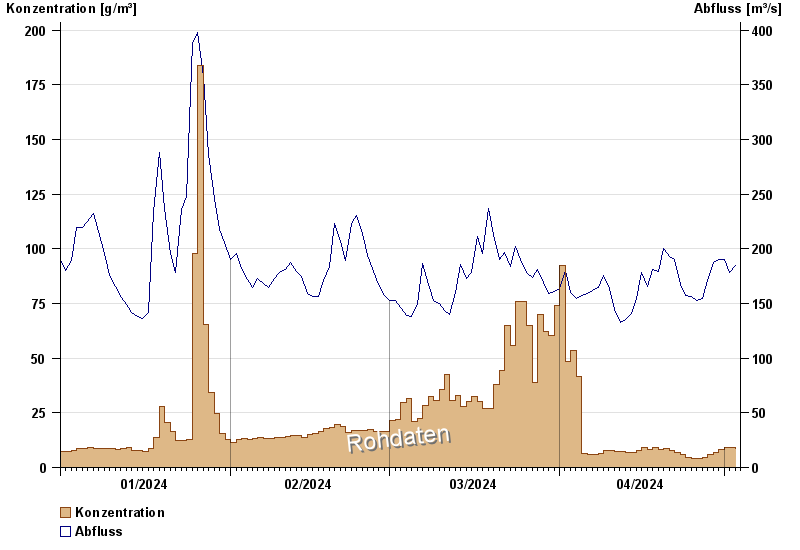
| Datum | Konzentration [g/m³] | Abfluss [m³/s] |
|---|---|---|
| 03.05.2024 | 8,5 | 185 |
| 02.05.2024 | 9,3 | 178 |
| 01.05.2024 | 9,0 | 190 |
| 30.04.2024 | 8,2 | 190 |
| 29.04.2024 | 7,0 | 188 |
| 28.04.2024 | 5,7 | 171 |
| 27.04.2024 | 4,5 | 155 |
© Bayerisches Landesamt für Umwelt 2024