
- Startseite >
- Flüsse >
- Schwebstoff >
- Inn >
- Neu Ulm, Bad Held >
- Jahresgrafik

Jahresgrafik Neu Ulm, Bad Held / Donau
Schwebstoff vom 01.01.2024 bis zum 16.04.2024
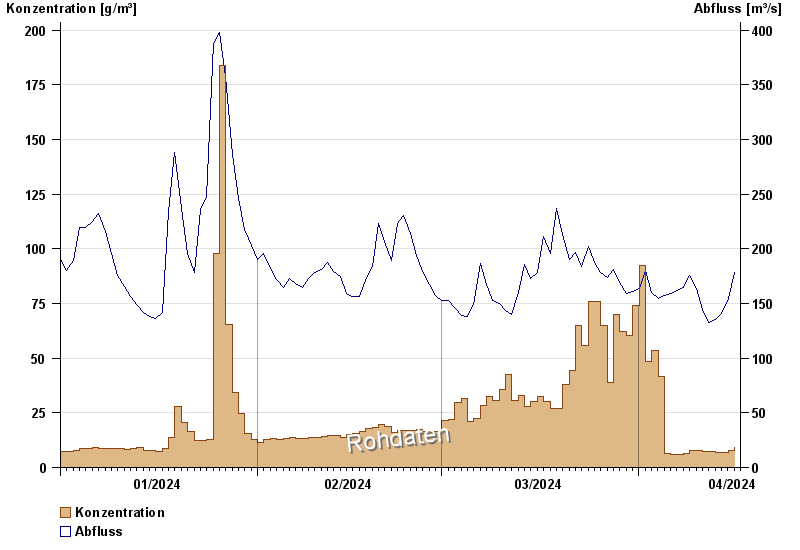
| Datum | Konzentration [g/m³] | Abfluss [m³/s] |
|---|---|---|
| 16.04.2024 | 9,4 | 178 |
| 15.04.2024 | 7,9 | 155 |
| 14.04.2024 | 6,7 | 141 |
| 13.04.2024 | 6,9 | 135 |
| 12.04.2024 | 7,5 | 133 |
| 11.04.2024 | 7,3 | 145 |
| 10.04.2024 | 7,6 | 164 |
© Bayerisches Landesamt für Umwelt 2024