
- Startseite >
- Flüsse >
- Schwebstoff >
- Iller - Lech - Bodensee >
- Rosenheim o.d. Mangfallmündung >
- Monatsgrafik

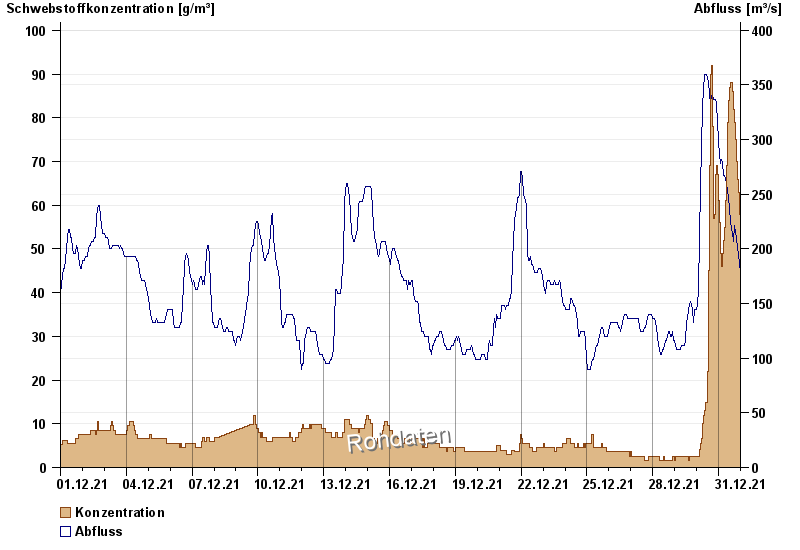
Monatsgrafik Rosenheim o.d. Mangfallmündung / Inn
Schwebstoff vom 01.12.2021 bis zum 31.12.2021
| Datum | Konzentration [g/m³] | Abfluss [m³/s] |
|---|---|---|
| 31.12.2021 23:45 | 55,0 | 178 |
| 31.12.2021 23:30 | 56,0 | 178 |
| 31.12.2021 23:15 | 57,0 | 182 |
| 31.12.2021 23:00 | 57,0 | 182 |
| 31.12.2021 22:45 | 58,0 | 182 |
| 31.12.2021 22:30 | 58,0 | 186 |
| 31.12.2021 22:15 | 59,0 | 186 |
© Bayerisches Landesamt für Umwelt 2024