
- Startseite >
- Flüsse >
- Schwebstoff >
- Iller - Lech - Bodensee >
- Rosenheim o.d. Mangfallmündung >
- Monatsgrafik

Monatsgrafik Rosenheim o.d. Mangfallmündung / Inn
Schwebstoff vom 01.03.2023 bis zum 31.03.2023
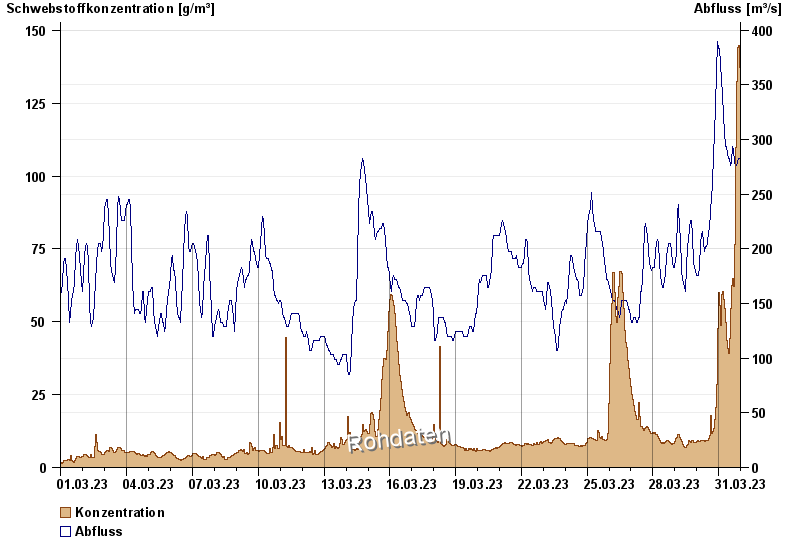
| Datum | Konzentration [g/m³] | Abfluss [m³/s] |
|---|---|---|
| 31.03.2023 23:45 | 113,6 | 279 |
| 31.03.2023 23:30 | 116,4 | 283 |
| 31.03.2023 23:15 | 118,4 | 283 |
| 31.03.2023 23:00 | 120,8 | 283 |
| 31.03.2023 22:45 | 122,9 | 283 |
| 31.03.2023 22:30 | 126,0 | 283 |
| 31.03.2023 22:15 | 128,5 | 283 |
© Bayerisches Landesamt für Umwelt 2024