
- Startseite >
- Flüsse >
- Schwebstoff >
- Iller - Lech - Bodensee >
- Rosenheim o.d. Mangfallmündung >
- Jahresgrafik

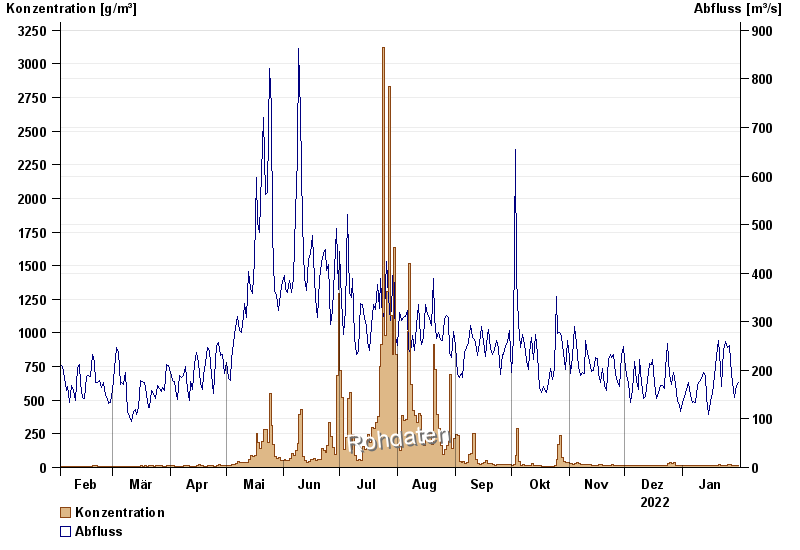
Jahresgrafik Rosenheim o.d. Mangfallmündung / Inn
Schwebstoff vom 01.02.2022 bis zum 31.01.2023
| Datum | Konzentration [g/m³] | Abfluss [m³/s] |
|---|---|---|
| 31.01.2023 | 13,5 | 174 |
| 30.01.2023 | 14,4 | 168 |
| 29.01.2023 | 13,8 | 144 |
| 28.01.2023 | 15,2 | 159 |
| 27.01.2023 | 17,6 | 192 |
| 26.01.2023 | 19,7 | 251 |
| 25.01.2023 | 19,2 | 247 |
© Bayerisches Landesamt für Umwelt 2024