
- Startseite >
- Flüsse >
- Abfluss >
- Naab - Regen >
- Pfrentsch >
- Jahresgrafik

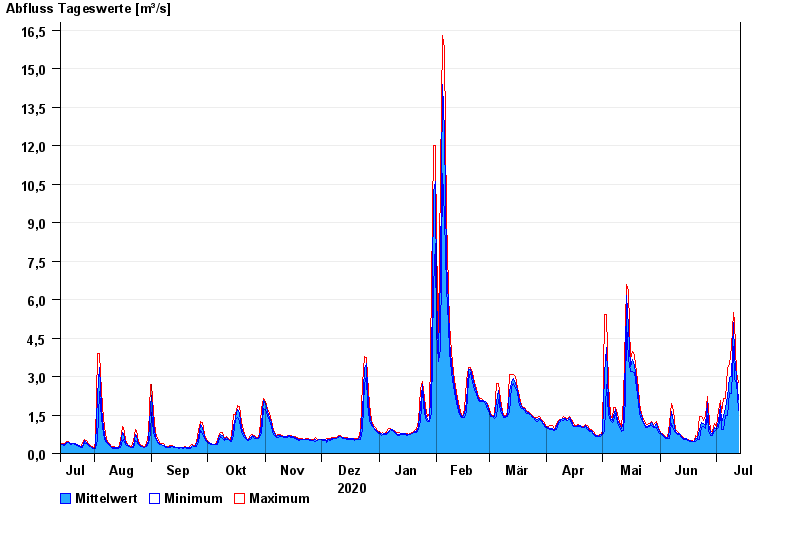
Jahresgrafik Pfrentsch / Pfreimd
Abfluss vom 14.07.2020 bis zum 13.07.2021
| Datum | Mittelwert [m³/s] | Maximum [m³/s] | Minimum [m³/s] |
|---|---|---|---|
| 13.07.2021 | 2,12 | 2,75 | 1,67 |
| 12.07.2021 | 3,01 | 3,15 | 2,75 |
| 11.07.2021 | 3,78 | 5,13 | 2,89 |
| 10.07.2021 | 5,11 | 5,51 | 4,19 |
| 09.07.2021 | 3,02 | 4,19 | 2,32 |
| 08.07.2021 | 2,96 | 3,45 | 2,39 |
| 07.07.2021 | 2,22 | 3,31 | 1,47 |
© Bayerisches Landesamt für Umwelt 2024