
- Startseite >
- Flüsse >
- Abfluss >
- Naab - Regen >
- Pfrentsch >
- Jahresgrafik

Jahresgrafik Pfrentsch / Pfreimd
Abfluss vom 14.07.2019 bis zum 13.07.2020
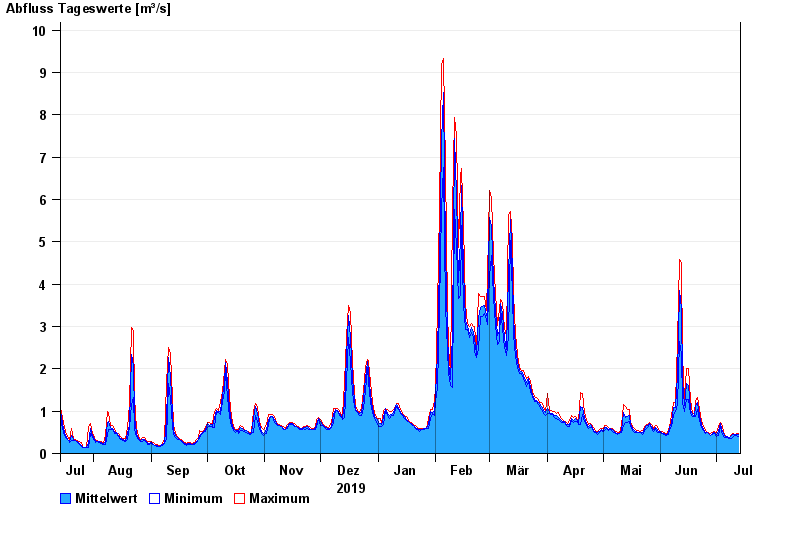
| Datum | Mittelwert [m³/s] | Maximum [m³/s] | Minimum [m³/s] |
|---|---|---|---|
| 13.07.2020 | 0,447 | 0,481 | 0,408 |
| 12.07.2020 | 0,458 | 0,481 | 0,432 |
| 11.07.2020 | 0,438 | 0,457 | 0,432 |
| 10.07.2020 | 0,447 | 0,482 | 0,409 |
| 09.07.2020 | 0,415 | 0,457 | 0,366 |
| 08.07.2020 | 0,371 | 0,388 | 0,345 |
| 07.07.2020 | 0,394 | 0,411 | 0,388 |
© Bayerisches Landesamt für Umwelt 2024