
- Startseite >
- Flüsse >
- Abfluss >
- Obere Donau >
- Freising >
- Jahresgrafik

Jahresgrafik Freising / Moosach
Abfluss vom 22.03.2024 bis zum 21.03.2025
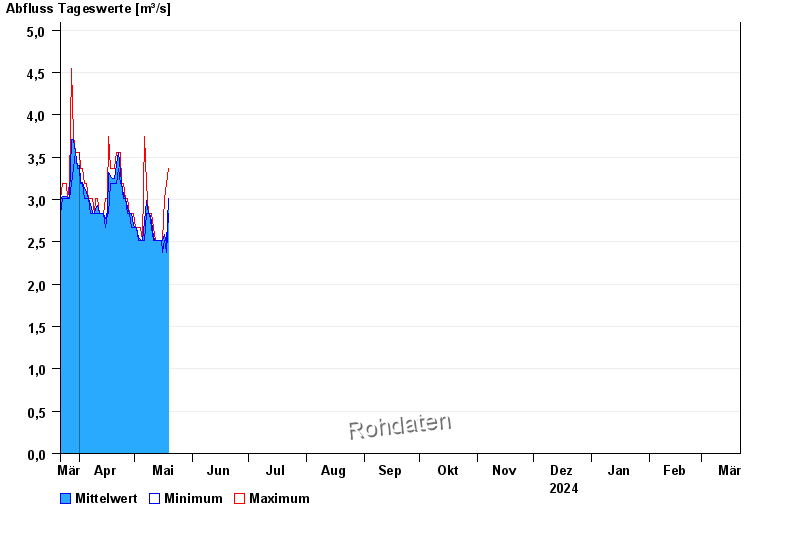
| Datum | Mittelwert [m³/s] | Maximum [m³/s] | Minimum [m³/s] |
|---|---|---|---|
| 08.05.2024 | 2,84 | 2,84 | 2,67 |
| 07.05.2024 | 2,94 | 3,19 | 2,84 |
| 06.05.2024 | 2,74 | 3,75 | 2,52 |
| 05.05.2024 | 2,52 | 2,52 | 2,52 |
| 04.05.2024 | 2,53 | 2,67 | 2,52 |
| 03.05.2024 | 2,55 | 2,67 | 2,52 |
| 02.05.2024 | 2,67 | 2,67 | 2,67 |
© Bayerisches Landesamt für Umwelt 2024