
- Startseite >
- Flüsse >
- Abfluss >
- Obere Donau >
- Freising >
- Jahresgrafik

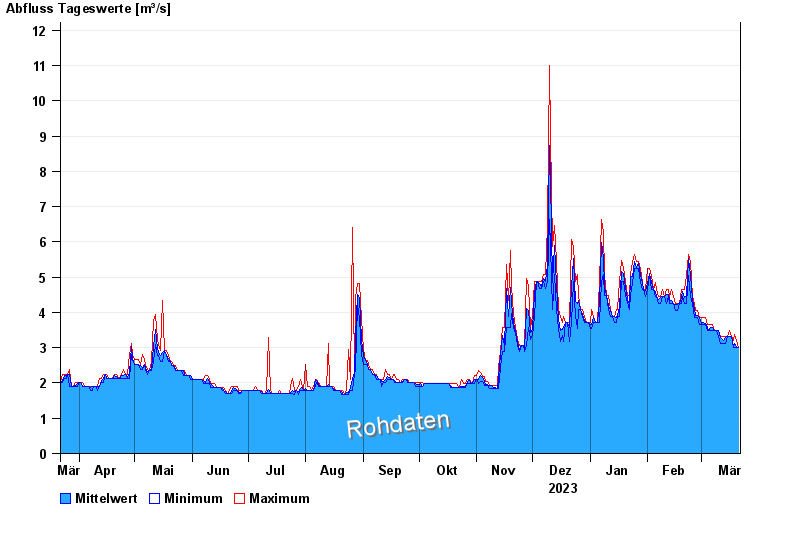
Jahresgrafik Freising / Moosach
Abfluss vom 22.03.2023 bis zum 21.03.2024
| Datum | Mittelwert [m³/s] | Maximum [m³/s] | Minimum [m³/s] |
|---|---|---|---|
| 21.03.2024 | 3,01 | 3,01 | 3,01 |
| 20.03.2024 | 3,02 | 3,19 | 3,01 |
| 19.03.2024 | 3,11 | 3,37 | 3,01 |
| 18.03.2024 | 3,04 | 3,19 | 3,01 |
| 17.03.2024 | 3,31 | 3,31 | 3,31 |
| 16.03.2024 | 3,33 | 3,49 | 3,31 |
| 15.03.2024 | 3,31 | 3,31 | 3,31 |
© Bayerisches Landesamt für Umwelt 2024