
- Startseite >
- Flüsse >
- Abfluss >
- Obere Donau >
- Beilngries oberh. der Sulz >
- Jahresgrafik

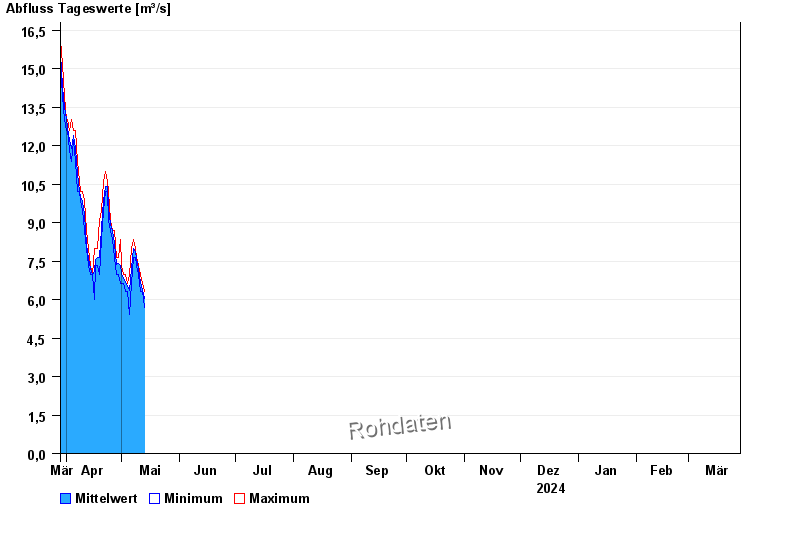
Jahresgrafik Beilngries oberh. der Sulz / Altmühl
Abfluss vom 29.03.2024 bis zum 28.03.2025
| Datum | Mittelwert [m³/s] | Maximum [m³/s] | Minimum [m³/s] |
|---|---|---|---|
| 28.04.2024 | 7,39 | 7,64 | 6,96 |
| 27.04.2024 | 8,2 | 8,7 | 7,64 |
| 26.04.2024 | 8,7 | 8,7 | 8,34 |
| 25.04.2024 | 8,92 | 9,07 | 8,7 |
| 24.04.2024 | 9,57 | 10,2 | 9,07 |
| 23.04.2024 | 10,4 | 10,6 | 10,2 |
| 22.04.2024 | 10,4 | 11 | 10,2 |
© Bayerisches Landesamt für Umwelt 2024